Project
Cost analysis by project for each project.
Show cost analysis by project, including the project cost list and drill-down into actual cost and shares by aggregation dimension.
Entry: In the cloud management platform, click the  navigation menu in the upper left, then click “Cost & Optimization / Billing / Cost Analysis / Project Cost” in the left menu.
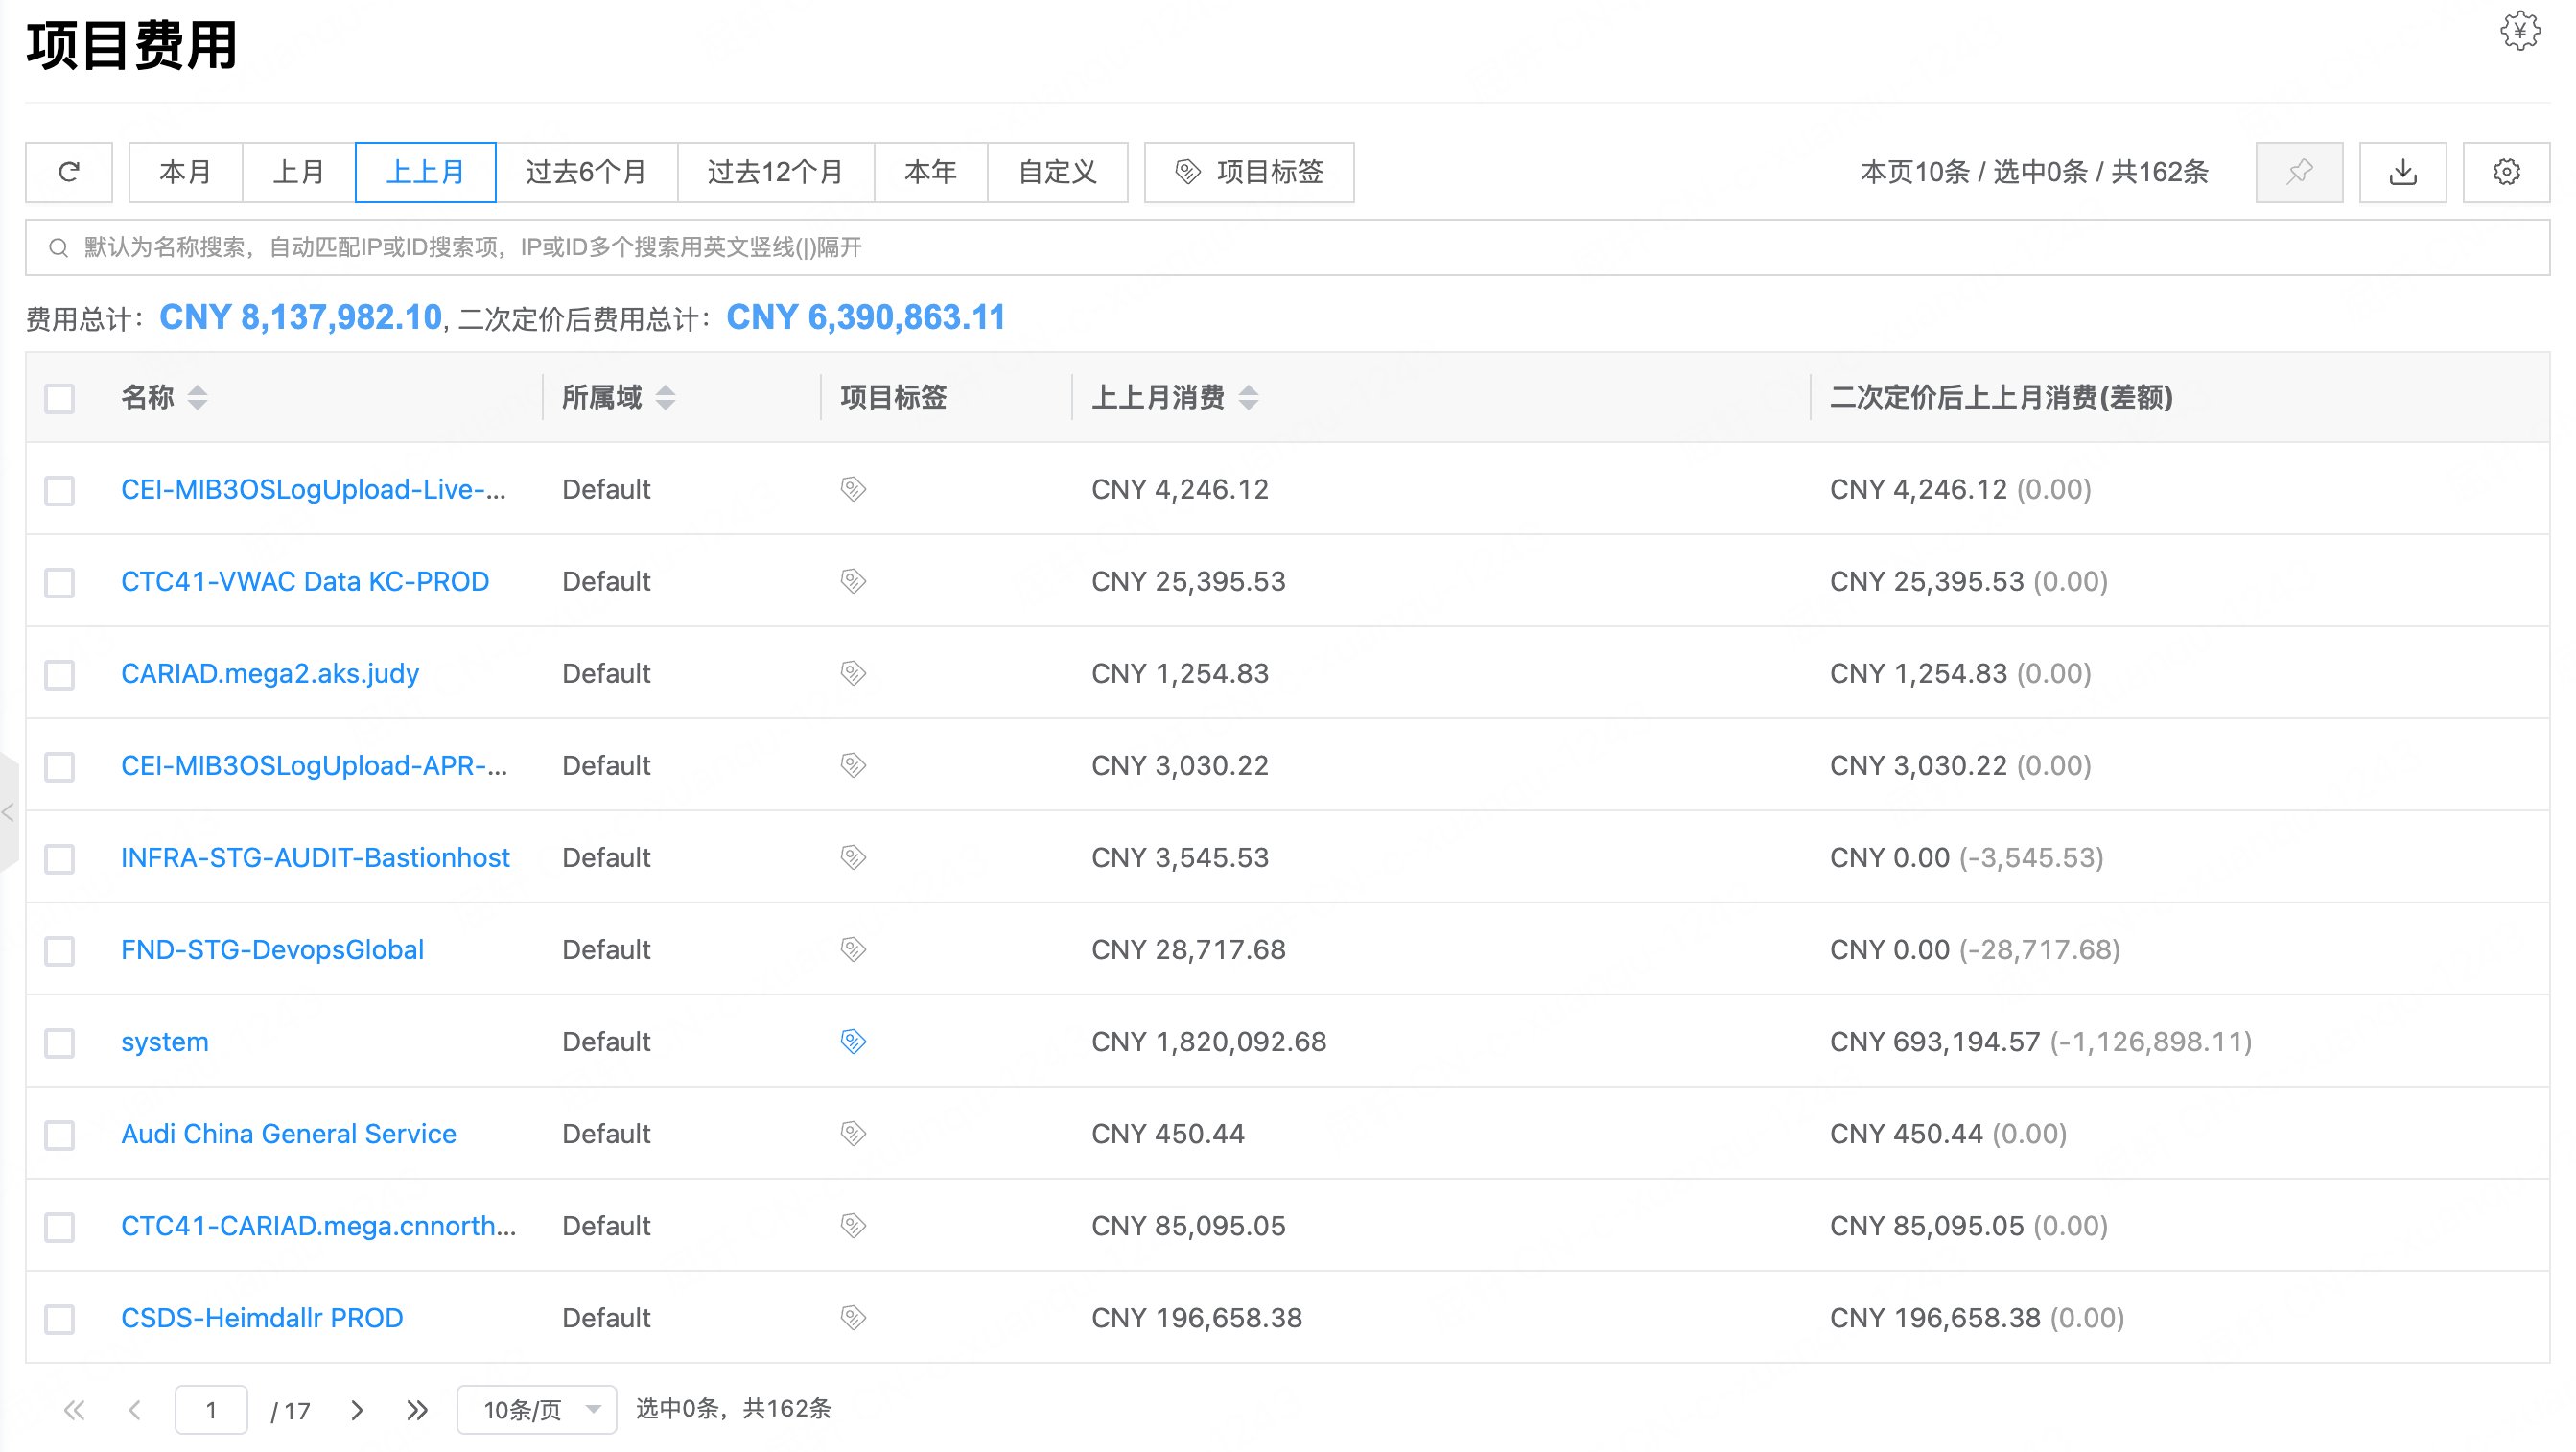
Page notes
Allocation switches
- “Prepaid allocation”: When enabled, prepaid resource costs are allocated per day or month. Spending = pay-as-you-go cost + allocated prepaid cost. Global switch for the entire Billing menu.
- “Project cost allocation”: Hidden by default. Appears after a public cloud account creates a policy on the “Project allocation” tab. When enabled, shared costs are attributed to projects by policy. Allocated total = already attributed cost + cost attributed by policy. Global switch for the entire Billing menu.
Currency
- With one currency, no dropdown; with multiple currencies, switch in the upper right (e.g. CNY, USD, BRL).
- With “Merge multi-currency bills” enabled, convert by exchange rate and summarize in one currency.
- With “Original bills” enabled, domain admin and project views can show original bills in the corresponding currency.
Time range
View spend for this month, last month, month before last, last 6 months, last 12 months, this year, or a custom range.

View project cost list
- List fields: name, domain, project tags, this-month spend, vs same period last month, spend after secondary pricing (difference), etc.
- Switch list data by the time ranges above.
- The top shows total cost for the current filters.
- Filter by name, domain, and other conditions.
View actual cost
- In the project cost list, click a name to open details.
- Click the “Actual cost” tab.
- After selecting a time range, view spend amounts and shares by dimension.
Under the current dimension you cannot aggregate again by “Domain”, “Project”, or “Project tag”.
Spend trends and chart toggle
- In bar-chart mode, click
 to switch to a line chart.
 - In line-chart mode, click
 to switch to a bar chart.
View by dimension
| Dimension | Description |
|---|---|
| Platform | List and pie chart of spend by platform. |
| Resource type | List and pie chart of spend by resource type. |
| Product | List and pie chart of spend by product (original public-cloud resource type). |
| Cloud account | Bar chart and list of top N cloud accounts by spend (default TOP 10; TOP 20, TOP 30, or all). |
| Cloud subscription | Bar chart and list of top N cloud subscriptions by spend. |
| Region | List and pie chart of spend by region. |
| Billing mode | List and pie chart of pay-as-you-go vs prepaid spend. |
| Attribution mode | List and pie chart of non-allocated cost and project allocation before/after. With project cost allocation on, shows after-allocation cost; otherwise before. Totals before and after allocation are unchanged. |
| Cloud project | List and pie chart of spend by cloud-side project. |
| Product category | List and pie chart of spend by product category. |
| Tag | Choose a tag key, then show by tag value. From “Advanced Settings / Bill Resources”. |
| Resource tag | Choose a tag key, then show by tag value. From tags set on resources in Resource Management. |
Export bills
- Excel: Click
 in the upper right to export bills.
 - PDF: Click
 in the upper right to export bills.