Resouce Types
Shows the cost analysis of each resouce types in the dimension of the resouce types.
Entry: In the cloud management platform click on the top left corner navigation menu, and click “Cost/Analysis/Resouce Types” menu item in the left menu bar that pops up to enter the resouce types page.
View the cost of resouce types
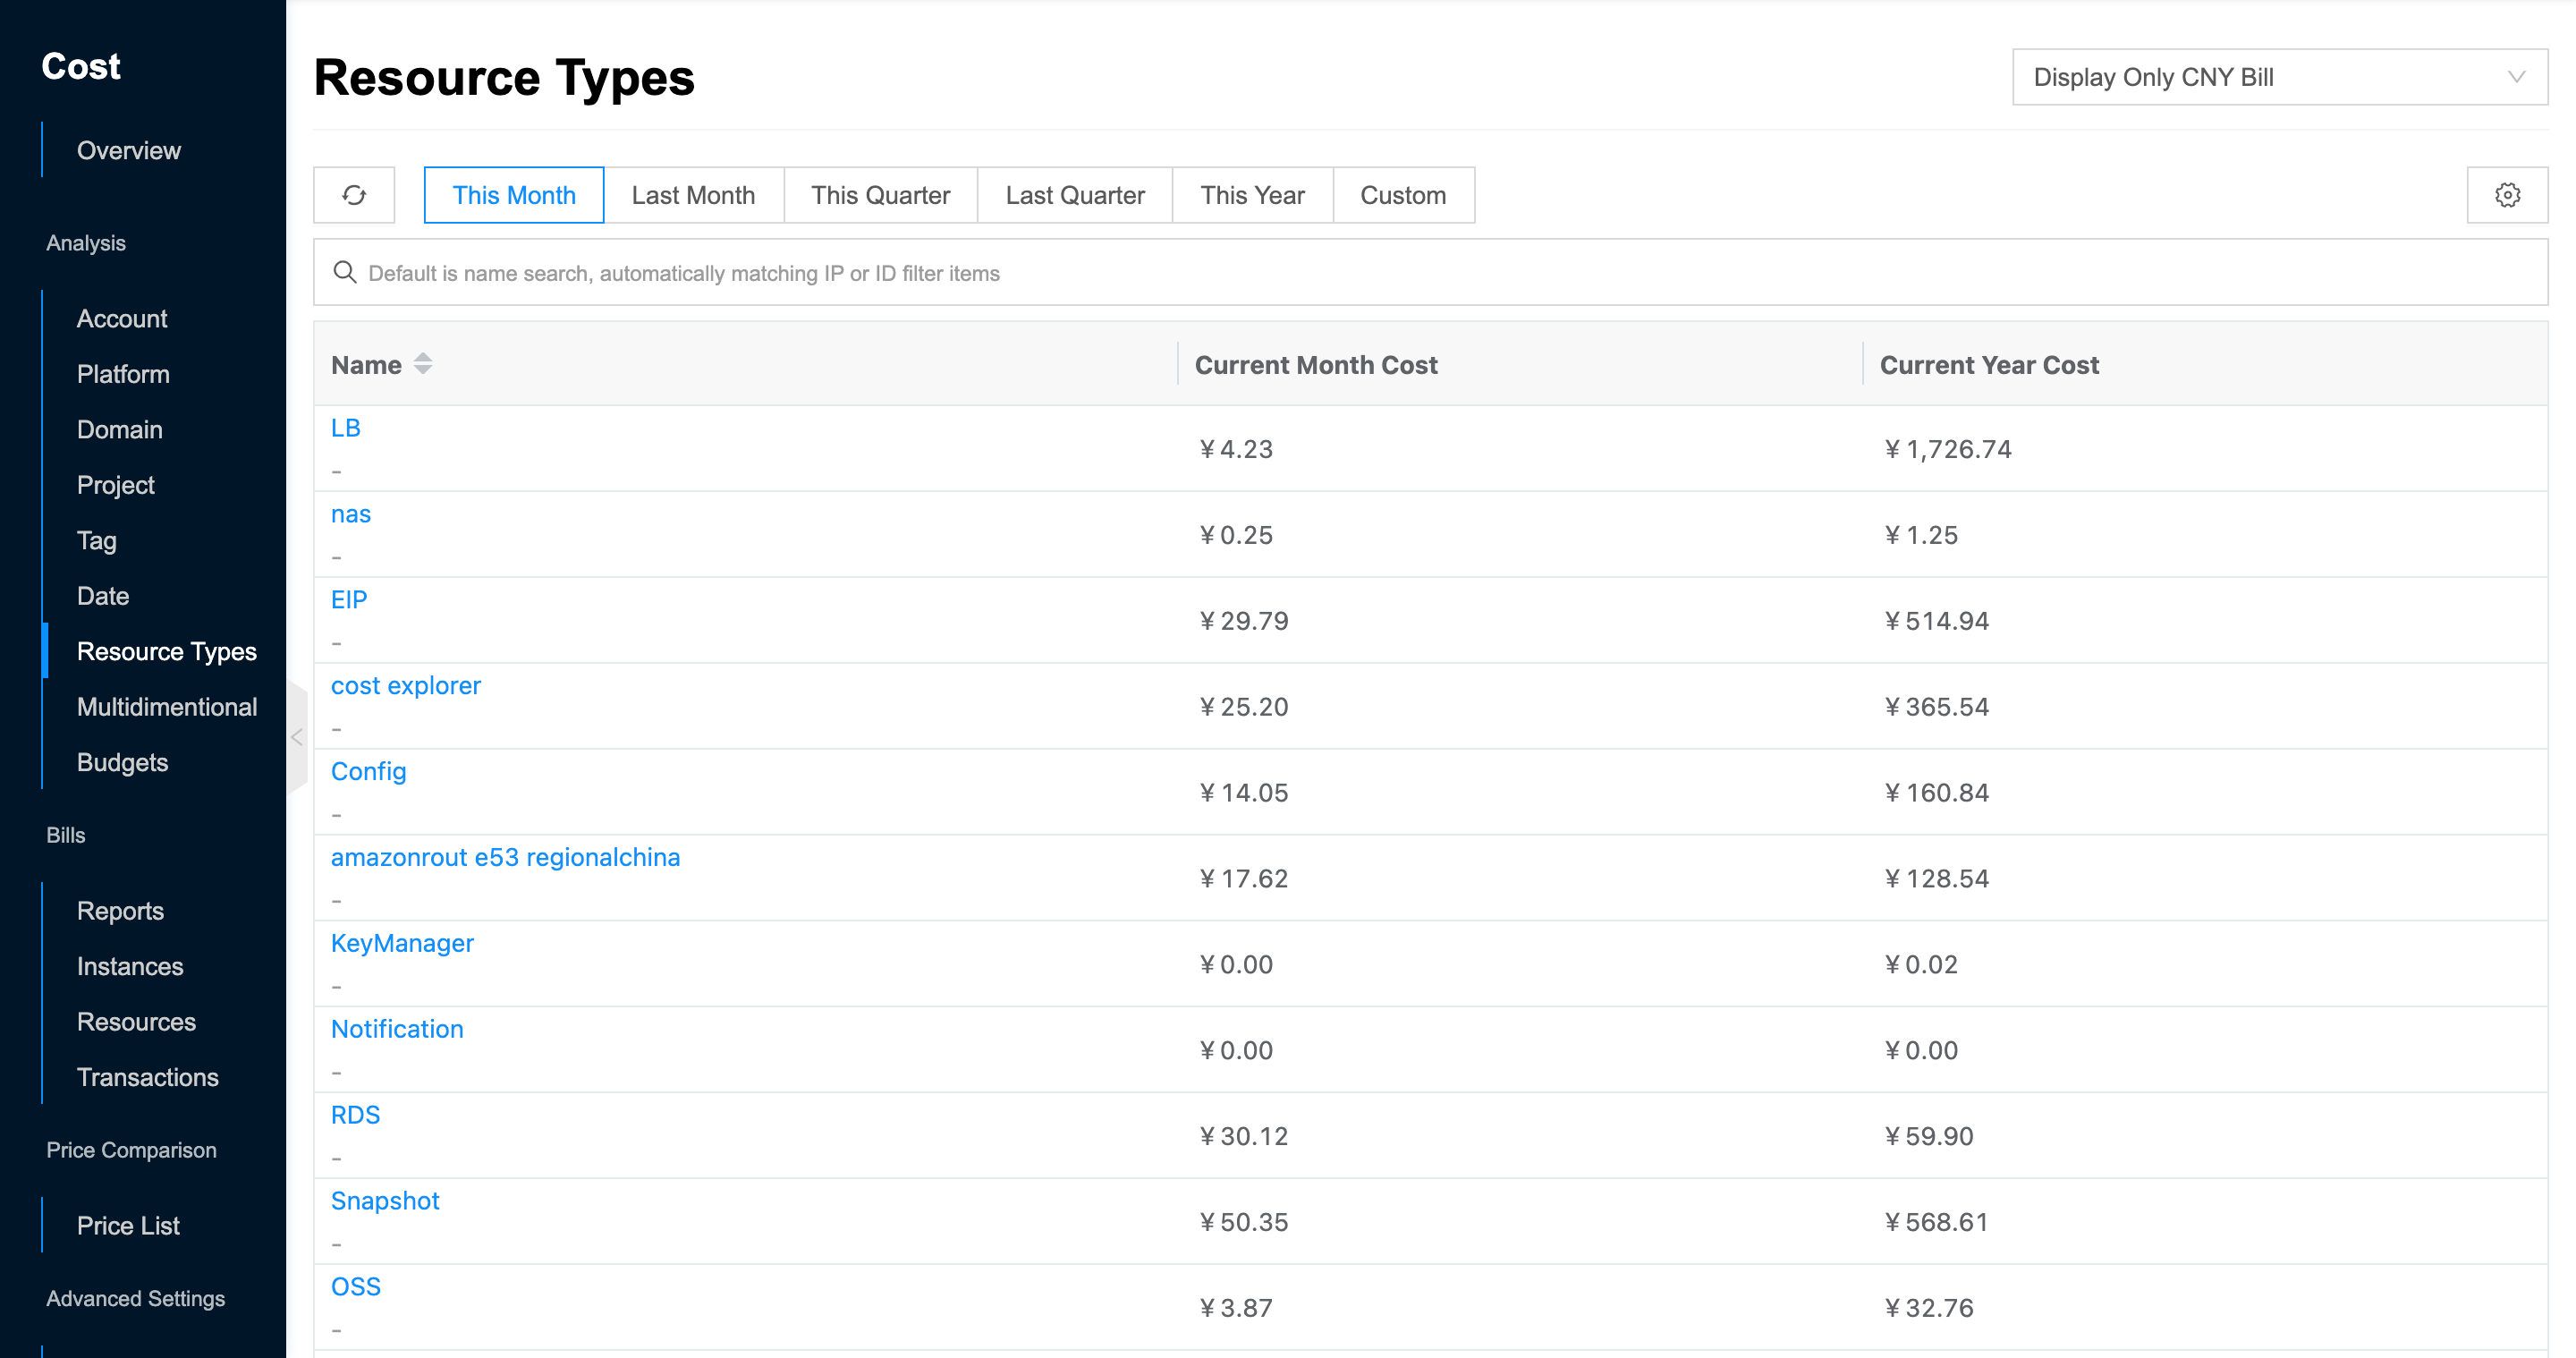
This function is used to view the consumption of all resouce typess in the system.
- In the resource type list, the current month cost and current year cost for each resource type in the system are displayed by default, with support for clicking on the top
 icon to see the consumption for this month, last month, this quarter, last quarter, this year or custom time.
 - When only one currency of bills exists in the platform, the drop-down list will not be displayed by default. When there are bills in multiple currencies at the same time, a drop-down list will appear in the upper right corner to switch the bills in the corresponding currencies, currently supporting RMB bills, USD bills and BRL bills.
- When the “Multi-currency bill Combined” is enabled in the global configuration, all bills will be displayed in a certain currency through the exchange rate conversion instead of directly displaying the bills in a specific currency.
- When the “Origin Bill” is enabled in the global configuration, in the domian view and project view, there will be a drop-down option to display the original bill in the corresponding currency.
View actual cost under a resouce type
This function is used to view the consumption trend under the specified resouce type and the percentage of consumption under different dimensions.
- On the resouce types page, click the resouce types name item to enter the actual cost under the resouce types page.
- When bill shared is enabled, the platform will spread the cost of the prepaid resource package to each day or month. The consumption amount on the cost overview page will change to the cost of pay per volume + the cost of prepaid package apportioned to each day or month. If you view the consumption trend of this month, the prepaid fee will be apportioned to each day, and if you view the data of this quarter or year, the prepaid fee will be apportioned to each month.
- View the following information.
-
Cost Trends: View consumption amounts and consumption trends under the resouce types in a bar graph format for a specified period of time.
-
View the consumption amount and percentage of total consumption for different platforms, resource types, resources, cloud accounts, cloud subscriptions, regions, billing modes, domains (departments), projects, tags, or custom for this month, last month, this quarter, last quarter, this year or custom time.
- Platform: Shows the consumption amount and proportion of different platforms on the cloud management platform in the form of a list, and the total consumption cost and the consumption amount and proportion of different platforms in the form of a ring chart.
- Cloud accounts: The consumption amount of cloud accounts that consume TOP N (default is TOP 10, support to modify to TOP 10, TOP 20, TOP 30, all) on cloud management platform in the form of bar chart and list. Support clicking the top right corner of
 icon to export the corresponding bill data.
 - Cloud subscriptions: Display the consumption amount of cloud subscriptions that consume TOP N (default is TOP 10, support modifying to TOP 10, TOP 20, TOP 30, all) on the cloud management platform in the form of bar graph and list. Support clicking the top right corner of icon to export the corresponding bill data.
- Region: Display the consumption amount and ratio of cloud management platform under different regions in the form of list; display the total consumption cost of cloud management platform and the consumption amount and ratio under different regions in the form of ring chart.
- Billing mode: To display the amount and proportion of consumption of postpaid and prepaid type billing modes on the cloud management platform in the form of a list; to display the total amount of consumption of the cloud management platform and the amount and proportion of consumption under different billing modes in the form of a ring chart.
- Domains : Displays the consumption amount and proportion of different domains on the cloud account in the form of a list; displays the total consumption cost of the cloud account and the consumption amount and proportion of different domains in the form of a ring chart. It is not visible under the project view.
- Projects: Click “Projects” button and select the domain in the pop-up dialog box, if not filled, it represents the statistics of items under all domains. Display the item name and consumption amount of TOP N (default is TOP 10, support to modify to TOP 10, TOP 20, TOP 30, All) consumption on the specified domain or platform in the form of bar chart and list.Support clicking the top right corner of icon to export the corresponding bill data.
- Tag: Click “Tag” button, select the tag in the pop-up input box, view the amount and proportion of resource consumption corresponding to different tag values under the specified tag in the form of a list; view the total amount of consumption under the specified tag, the amount and proportion of resource consumption corresponding to different tag values in the form of a ring chart.

- Custom: Click “Custom” button, select the custom dimension in the pop-up input box, and view the amount and proportion of resource consumption corresponding to different dimension items under the specified dimension in the form of a list; view the total amount of consumption under the specified dimension, the amount and proportion of consumption corresponding to different dimension values in the form of a ring chart.
-