Dashboard
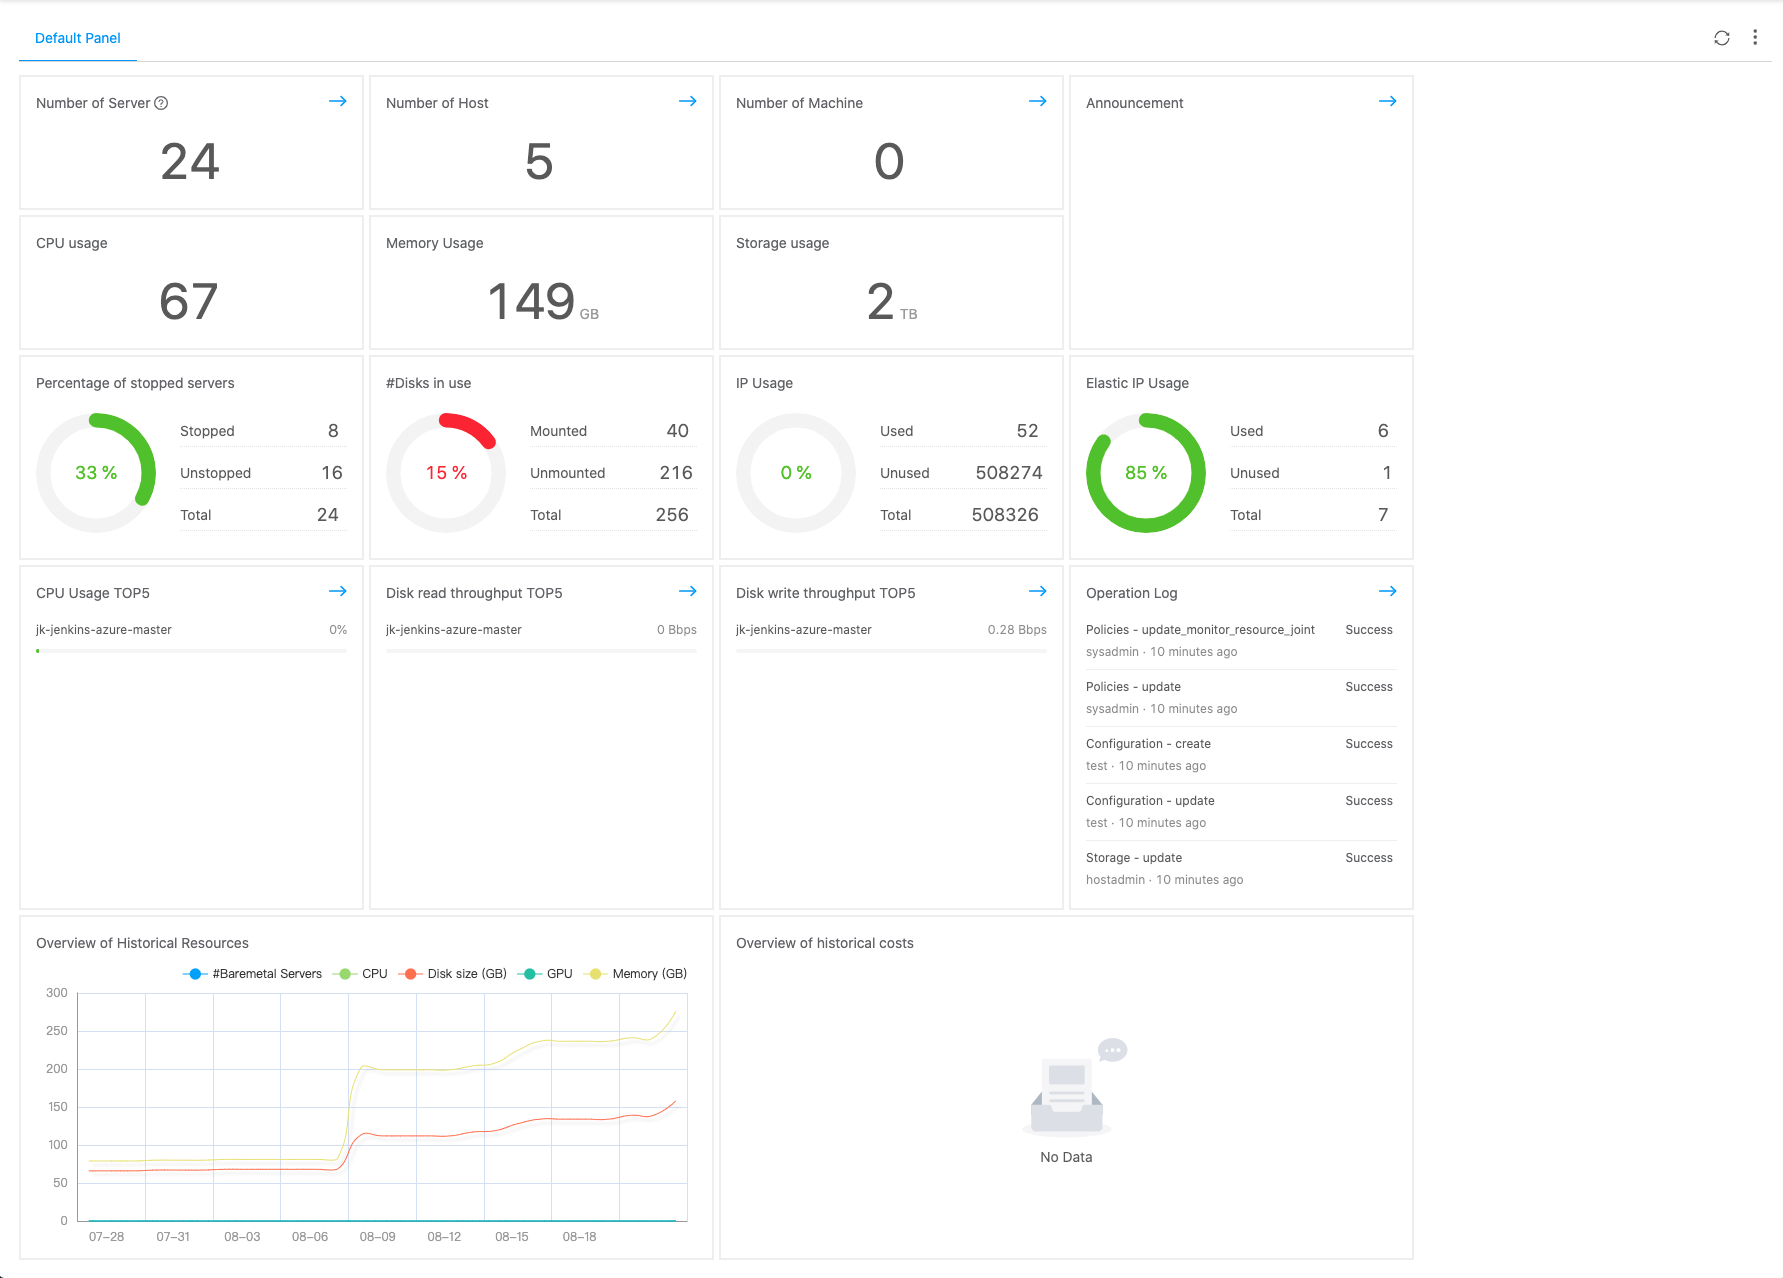
The dashboard is used to display the platform’s parameters and indicators and other information, so that users can quickly understand the use of the system. The new dashboard has built-in default templates for Admin Backend view, Domain Admin Backend view and Project view, and supports customizing the display metrics of the dashboard under any view to customize the dashboard for users' needs.
Entry: In the cloud management platform click on the top left corner  navigation menu, and click “Control Panel” menu item in the left menu bar that pops up to enter the Control Panel page.
- In the Control Panel page, click on the top right of the indicator
 icon will jump to the corresponding resource page, e.g. click on the top right of the indicator for the number of virtual machines icon at the top right of the virtual machine count indicator will redirect you to the virtual machine list page.
Dashboard Management
The default dashboard does not support deleting and editing at the moment. For description of Dashboard related metrics, please refer to Metrics.
New dashboard
When the default dashboard does not meet the user’s needs, the user can create a new dashboard to customize the dashboard for the user. Control panels can be created in different views.
-
On the Dashboard page, click on the top right corner of the Dashboard
 icon and select the drop-down menu “New” menu item to enter the New Dashboard page.
 -
Set the dashboard name and drag and drop tiles from the tile library to configure them as follows.
-
General configuration: Any tile is supported
 , Configure
 , copy and paste
 operations, and zooming in and out of tiles. The following section focuses on how to configure tiles.
 -
Digital Map: used to display the number of resources.
-
Drag and drop the digital image tile anywhere in the panel, click the tile’s
icon to bring up the Configure Tile dialog box on the right. -
Configure the following parameters.

- Type: Supports setting host resources and container resources.
- When setting “Host resource”, configure the following parameters.
- Widget Name: Customize the name of the metrics displayed in the tile.
- Cloud environment and platform: Select the platform for metrics statistics, if not, it represents all platforms.
- Region or cloud account: Select the region or cloud account for the metrics statistics, if not selected, it represents all regions or all cloud accounts.
- Indicator: Select the specific indicator value, such as server represents the number of servers, etc.
- When setting up “container resources”, configure the following parameters.
- Widget Name: Customize the name of the metric displayed in the tile.
- Metrics: Select container-related metrics, such as all.cluster.count for the number of container clusters.
-
When the configuration is finished, click “OK” button to save the configuration.
-
-
Usage Rate: Used to show the utilization rate of resources.
-
Drag and drop the usage tile to any position in the panel, click the tile’s
icon of the tile to bring up the Configure Tile dialog box on the right. -
Configure the following parameters.

- Type: Supports setting host resources and container resources.
- When setting “Host resource”, configure the following parameters.
- Widget Name: Customize the name of the metrics displayed in the tile, such as memory utilization, etc.
- Cloud environment and platform: Select the platform for metrics statistics, if not, it represents all platforms.
- Region or cloud account: Select the region or cloud account for metrics statistics, if not, it represents all regions or all cloud accounts.
- Total quantity indicator and usage indicator: The usage rate is the ratio of usage to total quantity. Select the corresponding indicators respectively. E.g. select host.memory (host memory capacity) for the total indicator and all.servers.memory (total server memory) for the utilization rate, and the ratio of the two is the memory utilization rate.
- When setting “container resources”, configure the following parameters.
- Widget Name: Customize the display name of the tile, such as container memory usage.
- Total metrics and usage metrics: The ratio of usage to total usage. Select the corresponding metrics, respectively.
-
When the configuration is finished, click the “OK” button to save the configuration.
-
-
Announcement: Used to display system announcements, the specific announcement display content needs to be configured in System Configuration - Announcements.
- Drag and drop the announcement tile to any position in the panel, click the tile’s icon and the Configure Tile dialog box will pop up on the right.
- Set the tile name and click the “OK” button to save the configuration.
 - Drag and drop the announcement tile to any position in the panel, click the tile’s
-
TOP5: Used to display information about the resources of the indicator TOP5.
-
Drag and drop the announcement tile to any location in the panel, click the tile’s
icon to bring up the Configure Tile dialog on the right. -
Configure the following parameters.

- Widget Name: Customize the name of the indicator displayed in the tile.
- Platform: Select the platform for the indicator statistics.
- Resource type: Select the resource type for the metrics statistics. When OneCloud , VMware, ZStack, DStack, HCSO are selected, the selection of hosts is supported.
- Metrics: Including CPU utilization, disk read speed, disk write speed, network inbound traffic, network outbound traffic, etc.
- TOP/Bottom: Select the metrics with the highest or lowest statistics.
- Show rows: Show the few records with the highest or lowest statistics.
- Near: Select the indicator of how long to count, including 5 minutes, 10 minutes, 15 minutes, 20 minutes, 25 minutes, 30 minutes, etc.
-
When the configuration is finished, click “OK” button to save the configuration.
-
-
Operation Log: Used to display operation log information.
-
Drag and drop the Operation Log tile anywhere in the panel, click the tile’s
icon,and in the Configure Tile dialog box popped up on the right side. -
Set the tile name and the number of rows to display.
-
When the configuration is finished, click the “OK” button to save the configuration.

-
-
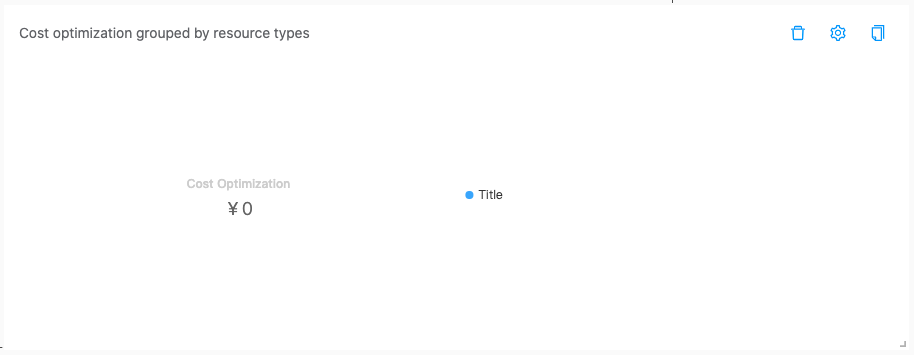
Cost optimization grouped by resource types: Used to show the percentage of different rule types in the optimization proposal.
- Drag the Cost Optimization Resource Type Distribution Cost Distribution tile to any location in the panel, click the tile’s icon, and the Configure Tile dialog box will pop up on the right side.
- Set the tile name and click the “OK” button to save the configuration.
- Drag the Cost Optimization Resource Type Distribution Cost Distribution tile to any location in the panel, click the tile’s
-
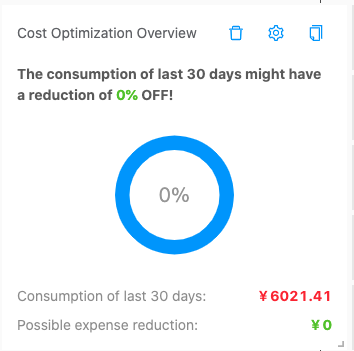
Cost Optimization Overview: Shows cost savings from cost optimization rules, estimated cost for the month, and cost savings utilization for the month.
- Drag and drop the Cost Optimization Overview tile anywhere in the panel, click the tile’s icon, and the Configure Tile dialog box will pop up on the right side.
- Set the tile name and click the “OK” button to save the configuration.
- Drag and drop the Cost Optimization Overview tile anywhere in the panel, click the tile’s
-
Quota: Shows the quota usage of the resource.
-
Drag and drop the quota tile anywhere in the panel, click the tile’s
icon, and the Configure Tile dialog box pops up on the right. -
Configure the following parameters.

- Widget Name: customize the name of the indicator displayed in the tile.
- Indicators: including CPU quota usage by domain, memory quota usage by domain, storage quota usage by domain, public IP quota usage by domain, IP quota usage by domain, GPU quota usage by domain, mirror quota usage by domain, and snapshot quota usage by domain.
-
When the configuration is complete, click the “OK” button to save the configuration.
-
-
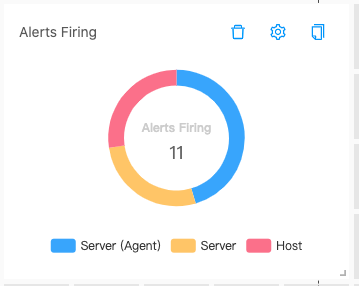
Alerts Firing: Display the number of alerts firing for different resource types.
-
Drag and drop the alerts firing tile to any location in the panel, click the tile’s
icon, and the Configure Tile dialog box will pop up on the right side. -
Set the tile name and click the “OK” button to save the configuration.
-
-
Proportion of consumption this month: Support displaying the consumption ratio of different resource types and the consumption ratio of this month’s platform respectively.
-
Drag and drop the tile of Proportion of consumption this month to any position in the panel, click the tile’s
icon, and the Configure Tile dialog box will pop up on the right side. -
Configure the following parameters.
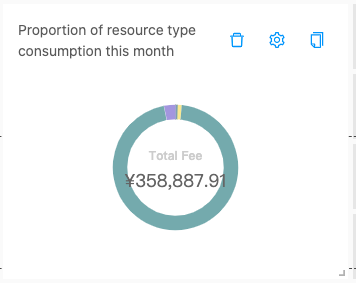
- Type: including the proportion of resource type consumption this month and the proportion of platform consumption this month
- Proportion of resource type consumption this month: that is, the consumption percentage of different resource types for this month is displayed. When this item is selected, the following parameters need to be configured.
- Widget Name: Customize the name of the indicator displayed by the tile.
- Currency: Select the currency of the tile display.
- Cloud Platform: Select the platform for the indicator statistics.
- Cloud Account: Select the cloud account for the indicator statistics.
- Proportion of platform consumption this month: that is, the consumption share of different platforms is displayed. When this item is selected, the following parameters need to be configured.
- Widget Name: Customize the name of the indicator displayed by the tile.
- Currency: Select the currency of the tile display.
-
When the configuration is finished, click “OK” button to save the configuration.
-
-
Consumption trends in the past 30 days: Display the consumption trend graph for the last 30 days.
-
drag and drop the last 30 days consumption trend tile to any position in the panel, click the tile’s
icon, and the Configure Tile dialog box will pop up on the right side. -
Configure the following parameters.

- Widget Name: customize the name of the indicator displayed in the tile.
- Currency: select the currency for the tile display.
- Cloud Platform: Select the platform for the indicator statistics.
- Cloud Account: Select the cloud account for the indicator statistics.
-
When the configuration is finished, click the “OK” button to save the configuration.
-
-
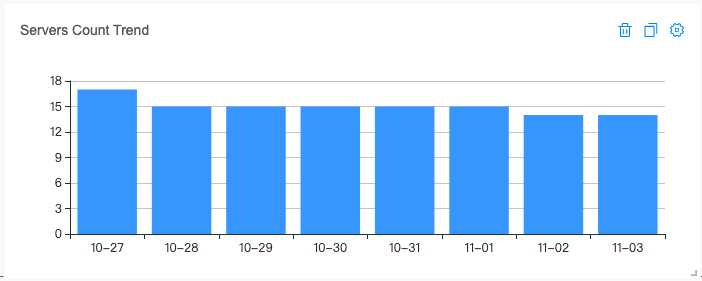
Servers Count Trend: Displays a trend graph of the number of servers over a customized period of time.
- Drag and drop the Servers Count Trend tile anywhere in the panel, click on the tile’s icon of the tile, and the Configure Tile dialog box will pop up on the right side.
- Set the tile name and time, and click the “OK” button to save the configuration when it is finished.
- Drag and drop the Servers Count Trend tile anywhere in the panel, click on the tile’s
-
Alert trend in the last 30 days: Display the trend graph of alarms in the past 30 days, and the proportion of alarms of different resource types, etc.
- Drag and drop the last 30 days alert trend tile to any position in the panel, click the tile’s icon, and the Configure Tile dialog box will pop up on the right side.
- Set the tile name and click “OK” button to save the configuration when it is finished.

- Drag and drop the last 30 days alert trend tile to any position in the panel, click the tile’s
-
Cloud account health status: The number of cloud accounts with normal status and the number of cloud accounts with abnormal status will be displayed.
- Drag and drop the cloud account health status tile to any location in the panel, click the tile’s icon, and the Configure Tile dialog box will pop up on the right side.
- Set the tile name and click “OK” button to save the configuration when it is finished.

- Drag and drop the cloud account health status tile to any location in the panel, click the tile’s
-
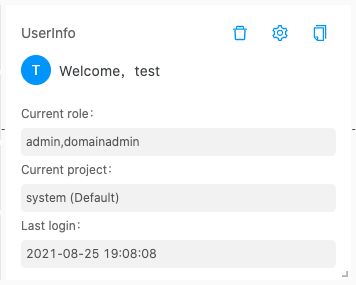
UserInfo: Includes the username, current role, current project, and last login time of the currently logged-in user.
- Drag and drop the UserInfo tile anywhere in the panel, click the tile’s icon of the tile, and the Configure Tile dialog box will pop up on the right side.
- Set the tile name and click “OK” button to save the configuration when it is finished.
- Drag and drop the UserInfo tile anywhere in the panel, click the tile’s
-
-
When the tile configuration is complete, click the top “Save” button to create the dashboard and display it on the Dashboard page.
Edit Dashboard
This function is used to modify the dashboard based on an existing dashboard. You can add or remove tiles or change the parameters of configured tiles, etc.
- In the Dashboard page, click on the top right corner of the dashboard icon and select the drop-down menu “Edit” menu item to enter the Edit Dashboard page.
- Support modifying the dashboard name, or adding or removing tiles or changing the parameters of configured tiles, etc.
- When the modification is finished, click the top “OK” button to complete the modification.
Exporting Dashboard
Users can export the configured dashboard and share it to other users.
- On the Dashboard page, click on the top right corner of the dashboard icon and select the drop-down menu “Export” menu item to download the dashboard file (with the ocdb suffix).
Importing Dashboard
Users can import the exported dashboard file to the platform for use.
- On the Dashboard page, click on the top right corner of the non-default Dashboard icon and select the drop-down menu “Import” menu item to bring up the Import dialog.
- Drag and drop the dashboard file (suffix ocdb) onto the dialog box and click the “OK” button.
- The imported dashboard will be displayed on the Dashboard page.
Clone Dashboard
This function is used to make a copy of an existing dashboard and display it in the Dashboard page. Users can edit and define their own panels based on the cloned dashboard.
- In the Dashboard page, click on the top right corner of the dashboard icon and select the drop-down menu “Clone” menu item to copy the dashboard.
- The cloned dashboard is identical to the original dashboard, only the name becomes name-1.
Reset dashboard
This function is used to reset the default panel, when the default dashboard is modified, you can use this function to restore to the initial state.
- In the Control Panel page, click the top right corner of the default dashboard icon and select the drop-down menu “Reset” menu item to bring up the operation confirmation dialog.
- Click the “OK” button to complete the operation.
Delete Dashboard
This function is used to delete an existing dashboard. Deleting the default dashboard will reset the default panel.
- On the Dashboard page, click on the top right corner of the dashboard icon and select the drop-down menu “Delete” menu item to bring up the action confirmation dialog.
- Click the “OK” button to complete the operation.
Metrics
| Kind | Metric | Description |
|---|---|---|
| usage | all.bucket_bytes | Object storage capacity |
| usage | all.bucket_objects | Number of object storage files |
| usage | all.buckets | Number of Buckets |
| usage | all.cpu_commit_rate.running | Server CPU oversold ratio in running state |
| usage | all.disks | Total Disk Capacity |
| usage | all.disks.mounted | Total capacity of mounted disks |
| usage | all.disks.unmounted | Total capacity of unmounted disks |
| usage | all.disks.unready | Disk capacity in abnormal state |
| usage | all.eip | All EIP and Public IPs |
| usage | all.eip.floating_ip | Total number of EIP |
| usage | all.eip.floating_ip.used | Number of used EIPs |
| usage | all.eip.public_ip | Total number of public IP |
| usage | all.eip.used | The number of Used EIP and public IPs |
| usage | all.memory_commit_rate.running | Server memory oversold ratio in running state |
| usage | all.nics | Total Allocated IPs |
| usage | all.nics.guest | Number of IPs for servers |
| usage | all.nics.host | Number of IPs for hosts |
| usage | all.nics.lb | Number of IPs for Load Balancers |
| usage | all.nics.reserve | Number of reserved IPs |
| usage | all.nics.guest.pending_delete | Number of IPs for servers in recycle-bin |
| usage | all.nics.netif | Number of IPs for network interfaces |
| usage | all.nics.eip | Number of Allocated EIPs |
| usage | all.nics.db | Number of IPs for RDS instances |
| usage | domain.nics | Total Allocated IPs in current domain |
| usage | domain.nics.guest | Number of IPs for servers in current domain |
| usage | domain.nics.host | Number of IPs for hosts in current domain |
| usage | domain.nics.lb | Number of IPs for Load Balancers in current domain |
| usage | domain.nics.reserve | Number of reserved IPs in current domain |
| usage | domain.nics.guest.pending_delete | Number of IPs for servers in recycle-bin in current domain |
| usage | domain.nics.netif | Number of IPs for network interfaces in current domain |
| usage | domain.nics.eip | Number of Allocated EIPs in current domain |
| usage | domain.nics.db | Number of IPs for RDS instances in current domain |
| usage | all.pending_delete_servers | Number of Servers in the Trash |
| usage | all.pending_delete_servers.cpu | The number of server CPUs in the trash |
| usage | all.pending_delete_servers.disk | Trash server disk capacity |
| usage | all.pending_delete_servers.ha | Number of highly available servers in the trash |
| usage | all.pending_delete_servers.ha.cpu | The number of highly available server CPUs in the trash |
| usage | all.pending_delete_servers.ha.disk | Trash highly available server disk capacity |
| usage | all.pending_delete_servers.ha.memory | Trash highly available server memory capacity |
| usage | all.pending_delete_servers.isolated_devices | Number of server GPU cards in the trash |
| usage | all.pending_delete_servers.memory | Trash server memory capacity |
| usage | all.ports | IP Total |
| usage | all.ports.eip | EIP Total |
| usage | all.ports_exit | Number of external IPs |
| usage | all.ports_exit.eip | Number of external EIPs |
| usage | all.ready_servers | Number of servers in shutdown state |
| usage | all.ready_servers.cpu | The number of CPUs of the server in the shutdown state |
| usage | all.ready_servers.disk | Server disk capacity in shutdown state |
| usage | all.ready_servers.ha | Number of highly available servers in shutdown state |
| usage | all.ready_servers.ha.cpu | The number of highly available server CPUs in the shutdown state |
| usage | all.ready_servers.ha.disk | Highly available server disk capacity in shutdown state |
| usage | all.ready_servers.ha.memory | Highly available server memory capacity in shutdown state |
| usage | all.ready_servers.isolated_devices | The number of server GPU cards in the shutdown state |
| usage | all.ready_servers.memory | Server memory capacity in shutdown state |
| usage | all.running_servers | Number of servers in running state |
| usage | all.running_servers.cpu | The number of server CPUs in the running state |
| usage | all.running_servers.disk | Server disk capacity in running state |
| usage | all.running_servers.ha | Number of highly available servers in running state |
| usage | all.running_servers.ha.cpu | The number of highly available server CPUs in the running state |
| usage | all.running_servers.ha.disk | Highly available server disk capacity in running state |
| usage | all.running_servers.ha.memory | Highly available server memory capacity in running state |
| usage | all.running_servers.isolated_devices | Number of server GPU cards in running state |
| usage | all.running_servers.memory | Server memory capacity in running state |
| usage | all.servers | Number of Servers |
| usage | all.servers.cpu | Server CPU Quantity |
| usage | all.servers.disk | Server Disk Capacity |
| usage | all.servers.ha | Number of highly available servers |
| usage | all.servers.ha.cpu | Highly available server CPU quantity |
| usage | all.servers.ha.disk | Highly available server disk capacity |
| usage | all.servers.ha.memory | Highly available server memory capacity |
| usage | all.servers.isolated_devices | Number of server GPU cards |
| usage | all.servers.memory | Server Memory Capacity |
| usage | all.snapshot | Number of snapshots |
| usage | baremetals | Number of baremetal servers |
| usage | baremetals.cpu | Baremetal Server CPU Quantity |
| usage | baremetals.memory | Baremetal Server Memory Capacity |
| usage | bucket_bytes | Current project object storage capacity |
| usage | bucket_objects | Number of object storage files in the current project |
| usage | buckets | Number of current project buckets |
| usage | disks | Current project disk capacity |
| usage | disks.mounted | The capacity of the mounted disks of the current project |
| usage | disks.unmounted | The capacity of the unmounted disk of the current project |
| usage | disks.unready | Disk capacity of the current project in abnormal state |
| usage | eip | The current project’s all EIP and public IPs |
| usage | eip.floating_ip | Total number of EIP of the current project |
| usage | eip.floating_ip.used | The number of EIP used by the current project |
| usage | eip.public_ip | The total number of public IP of the current project |
| usage | eip.used | The number of EIP and public IPs used in the current project |
| usage | enabled_hosts | Number of enabled hosts |
| usage | enabled_hosts.cpu | The number of enabled host CPUs |
| usage | enabled_hosts.cpu.virtual | The number of virtual host CPUs enabled |
| usage | enabled_hosts.memory | Enable host memory capacity |
| usage | enabled_hosts.memory.virtual | Enable virtual capacity of host memory |
| usage | hosts | Total number of hosts |
| usage | hosts.cpu | Host CPU Total (Excluding Reserved CPU) |
| usage | hosts.cpu.virtual | Host CPU Virtual Total |
| usage | hosts.cpu.total | Host CPU Total |
| usage | hosts.memory | Host memory capacity (Excluding Reserved Memory) |
| usage | hosts.memory.virtual | Host memory virtual capacity |
| usage | hosts.memory.total | Host memory capacity |
| usage | isolated_devices | GPU Card Total |
| usage | networks | Total IP Subnets |
| usage | nics | Number of allocated IPs in current project |
| usage | nics.guest | Number of IPs for servers in current project |
| usage | nics.lb | The number of IPs for load balancers in current project |
| usage | nics.reserve | Number of reserved IPs in current project |
| usage | nics.guest.pending_delete | Number of IPs for servers in recycle-bin in current project |
| usage | nics.eip | Number of EIPs in current project |
| usage | nics.db | Number of IPs for RDS instances in current project |
| usage | pending_delete_servers | The number of servers in the current project trash |
| usage | pending_delete_servers.cpu | The number of CPUs in the current project’s trash server |
| usage | pending_delete_servers.disk | Current project trash server disk capacity |
| usage | pending_delete_servers.ha | Number of highly available servers in the current project trash |
| usage | pending_delete_servers.ha.cpu | The number of highly available server CPUs in the current project trash |
| usage | pending_delete_servers.ha.disk | Current project trash highly available server disk capacity |
| usage | pending_delete_servers.ha.memory | Current project trash highly available server memory capacity |
| usage | pending_delete_servers.isolated_devices | The number of GPU cards in the current project trash server |
| usage | pending_delete_servers.memory | Current project trash server memory capacity |
| usage | ports | All IPs in the current project |
| usage | ports.eip | All EIPs in the current project |
| usage | ports_exit | The number of IPs in the current project |
| usage | ports_exit.eip | The number of EIPs in the current project |
| usage | ready_servers | The number of servers in the current project shutdown state |
| usage | ready_servers.cpu | The number of CPUs of the server in the shutdown state of the current project |
| usage | ready_servers.disk | The disk capacity of the server in the shutdown state of the current project |
| usage | ready_servers.ha | The number of highly available servers in the shutdown state of the current project |
| usage | ready_servers.ha.cpu | The number of highly available server CPUs in the current project shutdown state |
| usage | ready_servers.ha.disk | Highly available server disk capacity in the shutdown state of the current project |
| usage | ready_servers.ha.memory | Highly available server memory capacity in the current project shutdown state |
| usage | ready_servers.isolated_devices | The number of server GPU cards in the shutdown state of the current project |
| usage | ready_servers.memory | The memory capacity of the server in the shutdown state of the current project |
| usage | regions | Total number of regions |
| usage | running_servers | The number of servers in the current project running state |
| usage | running_servers.cpu | The number of server CPUs in the current project running state |
| usage | running_servers.disk | The server disk capacity of the current project running state |
| usage | running_servers.ha | The number of highly available servers in the current project running state |
| usage | running_servers.ha.cpu | The number of highly available server CPUs in the current project running state |
| usage | running_servers.ha.disk | Highly available server disk capacity of the current project running state |
| usage | running_servers.ha.memory | Highly available server memory capacity of the current project running state |
| usage | running_servers.isolated_devices | The number of server GPU cards in the current project running state |
| usage | running_servers.memory | The server memory capacity of the current project running state |
| usage | servers | Number of servers in the current project |
| usage | servers.cpu | The number of CPUs in the current project server |
| usage | servers.disk | Current project server disk capacity |
| usage | servers.ha | Number of highly available servers for the current project |
| usage | servers.ha.cpu | The number of highly available server CPUs in the current project |
| usage | servers.ha.disk | Highly available server disk capacity of the current project |
| usage | servers.ha.memory | Current project highly available server memory capacity |
| usage | servers.isolated_devices | Number of GPU cards in the current project server |
| usage | servers.memory | Current project server memory capacity |
| usage | snapshot | The number of snapshots of the current project |
| usage | storages | Total Storage Capacity |
| usage | storages.commit_rate | Storage oversold ratio |
| usage | storages.virtual | Total storage virtual capacity |
| usage | vpcs | VPC number of private network |
| usage | wires | Number of L2 Networks |
| usage | zones | Number of Zones |
| usage | all.disks.count | Number of Disks |
| usage | all.disks.mounted.count | Number of mounted disks |
| usage | all.disks.unmounted.count | Number of unmounted disks |
| usage | all.disks.unready.count | Number of abnormal disks |
| usage | all.loadbalancer | Load balancer quantity |
| usage | all.cache | Number of Redis instances |
| usage | all.rds | Number of RDS instances |
| usage | all.servers.system | Number of servers used by the system |
| usage | all.disks.system | System storage usage |
| usage | all.servers.system.cpu | System server CPU usage |
| usage | all.servers.system.memory | System server memory usage |
| usage | cache | Number of Redis in the current project |
| usage | disks.count | Number of disks in the current project |
| usage | disks.mounted.count | Number of mounted disks under the current project |
| usage | disks.unmounted.count | Number of unmounted disks in the current project |
| usage | disks.unready.count | Number of abnormal disks in the current project |
| usage | loadbalancer | The number of load balancers under the current project |
| usage | rds | Number of RDS instances in the current project |
| usage | domain.baremetals | The number of baremetal servers in the current domain |
| usage | domain.baremetals.cpu | Current domain baremetal server CPU quantity |
| usage | domain.baremetals.memory | Current domain baremetal server memory capacity |
| usage | domain.bucket_bytes | Current domain object storage capacity |
| usage | domain.bucket_objects | The current number of domain object storage files |
| usage | domain.buckets | The current number of domain buckets |
| usage | domain.cache | Number of Redis instances in the current domain |
| usage | domain.cpu_commit_rate.running | The server CPU oversell ratio of the current domain running state |
| usage | domain.disks | Current Domain Disk Total Capacity |
| usage | domain.disks.mounted | Total capacity of mounted disks in the current domain |
| usage | domain.disks.mounted.count | The number of disks currently attached to the domain |
| usage | domain.disks.count | Total number of current domain disks |
| usage | domain.disks.unmounted | Total capacity of unmounted disks in the current domain |
| usage | domain.disks.unmounted.count | Total number of unmounted disks in the current domain |
| usage | domain.disks.unready | The disk capacity of the current domain in abnormal state |
| usage | domain.disks.unready.count | The number of disks in the current abnormal state of the domain |
| usage | domain.eip | All EIP and public IP of the current domain |
| usage | domain.eip.floating_ip | Total number of EIP of the current domain |
| usage | domain.eip.floating_ip.used | The number of EIPs used by the current domain |
| usage | domain.eip.public_ip | Total public IP of the current domain |
| usage | domain.eip.used | The number of EIP and public IPs used by the current domain |
| usage | domain.enabled_hosts | The number of hosts enabled in the current domain |
| usage | domain.enabled_hosts.cpu | The number of host CPUs enabled in the current domain |
| usage | domain.enabled_hosts.cpu.virtual | The number of virtual host CPUs enabled by the current domain |
| usage | domain.enabled_hosts.memory | The host memory capacity enabled by the current domain |
| usage | domain.enabled_hosts.memory.virtual | The virtual capacity of host memory enabled by the current domain |
| usage | domain.hosts | Total number of current domain hosts |
| usage | domain.hosts.cpu | Current domain host CPU total number |
| usage | domain.hosts.cpu.virtual | Current domain host CPU virtual total |
| usage | domain.hosts.memory | Current domain host memory capacity |
| usage | domain.hosts.memory.virtual | Current domain host memory virtual capacity |
| usage | domain.loadbalancer | The number of current domain load balancer instances |
| usage | domain.memory_commit_rate.running | The server memory oversold ratio in the current domain running state |
| usage | domain.pending_delete_servers | The number of servers in the current domain trash |
| usage | domain.pending_delete_servers.cpu | The number of CPUs in the current domain trash server |
| usage | domain.pending_delete_servers.disk | Current domain trash server disk capacity |
| usage | domain.pending_delete_servers.ha | Number of highly available servers in the current domain trash |
| usage | domain.pending_delete_servers.ha.cpu | The number of highly available server CPUs in the current domain trash |
| usage | domain.pending_delete_servers.ha.disk | Current domain trash highly available server disk capacity |
| usage | domain.pending_delete_servers.ha.memory | Current domain trash highly available server memory capacity |
| usage | domain.pending_delete_servers.isolated_devices | The number of GPU cards in the current domain trash server |
| usage | domain.pending_delete_servers.memory | Current domain trash server memory capacity |
| usage | domain.ports | Current Domain IP Total |
| usage | domain.ports.eip | Current Domain EIP Total |
| usage | domain.ports_exit | Current number of IPs in the current domain |
| usage | domain.ports_exit.eip | Current number of EIPs in the current domain |
| usage | domain.rds | The number of RDS instances in the current domain |
| usage | domain.ready_servers | The number of servers in the current domain shutdown state |
| usage | domain.ready_servers.cpu | The number of CPUs of the server in the current domain shutdown state |
| usage | domain.ready_servers.disk | The disk capacity of the server in the current domain shutdown state |
| usage | domain.ready_servers.ha | The number of highly available servers in the current domain shutdown state |
| usage | domain.ready_servers.ha.cpu | The number of highly available server CPUs in the current domain shutdown state |
| usage | domain.ready_servers.ha.disk | Highly available server disk capacity in the current domain shutdown state |
| usage | domain.ready_servers.ha.memory | Highly available server memory capacity in the current domain shutdown state |
| usage | domain.ready_servers.isolated_devices | The number of server GPU cards in the current domain shutdown state |
| usage | domain.ready_servers.memory | The server memory capacity in the current domain shutdown state |
| usage | domain.running_servers | The number of servers in the current domain running state |
| usage | domain.running_servers.cpu | The number of server CPUs in the current domain running state |
| usage | domain.running_servers.disk | Server disk capacity in the current domain running state |
| usage | domain.running_servers.ha | The number of highly available servers in the current domain running state |
| usage | domain.running_servers.ha.cpu | The number of highly available server CPUs in the current domain running state |
| usage | domain.running_servers.ha.disk | Highly available server disk capacity of the current domain running state |
| usage | domain.running_servers.ha.memory | Highly available server memory capacity of the current domain running state |
| usage | domain.running_servers.isolated_devices | The number of server GPU cards in the current domain running state |
| usage | domain.running_servers.memory | The server memory capacity of the current domain running state |
| usage | domain.servers | The current number of domain servers |
| usage | domain.servers.cpu | Current domain server CPU number |
| usage | domain.servers.disk | Current domain server disk capacity |
| usage | domain.servers.ha | The number of highly available servers in the current domain |
| usage | domain.servers.ha.cpu | The number of CPUs in the current domain highly available server |
| usage | domain.servers.ha.disk | Current Domain Highly Available Server Disk Capacity |
| usage | domain.servers.ha.memory | Current domain highly available server memory capacity |
| usage | domain.servers.isolated_devices | The current number of domain server GPU cards |
| usage | domain.servers.memory | Current domain server memory capacity |
| usage | domain.snapshot | The number of current domain snapshots |
| usage | domain.storages | Current domain storage capacity |
| usage | domain.storages.commit_rate | Current domain storage oversold ratio |
| usage | domain.storages.virtual | Current domain storage total virtual capacity |
| usage | domain.vpcs | The current number of domain private network VPCs |
| usage | all.img.total.size | Total Size of Images |
| usage | domain.img.total.size | Total Size of Images of current domain |
| usage | img.total.size | Total Size of Images of current project |
| usage | all.iso.total.size | Total Size of ISOs |
| usage | domain.iso.total.size | Total Size of ISOs of current domain |
| usage | iso.total.size | Total Size of ISOs of current project |
| usage | all.imgiso.total.size | Total Size of Images and ISOs |
| usage | domain.imgiso.total.size | Total Size of Images and ISOs of current domain |
| usage | imgiso.total.size | Total Size of Images and ISOs of current project |
| usage | all.pending_delete_servers.last_week | The number of deleted servers last week |
| usage | domain.pending_delete_servers.last_week | The number of deleted servers in the current domain last week |
| usage | pending_delete_servers.last_week | The number of deleted servers in the current project last week |
| usage | all.servers.last_week | The number of created servers last week |
| usage | domain.servers.last_week | The number of created servers in the current domain last week |
| usage | servers.last_week | The number of created servers in the current project last week |
| k8s_usage | all.cluster.count | Number of clusters |
| k8s_usage | all.cluster.node.count | Number of Nodes |
| k8s_usage | all.cluster.node.not_ready_count | Number of unhealthy nodes |
| k8s_usage | all.cluster.node.ready_count | Number of healthy nodes |
| k8s_usage | all.cluster.node.pod.capacity | Maximum number of pods |
| k8s_usage | all.cluster.node.pod.count | Pod number |
| k8s_usage | all.cluster.node.cpu.capacity | cpu total |
| k8s_usage | all.cluster.node.cpu.limit | cpu limit number |
| k8s_usage | all.cluster.node.cpu.request | cpu usage |
| k8s_usage | all.cluster.node.memory.capacity | Total Memory |
| k8s_usage | all.cluster.node.memory.limit | Memory Limit |
| k8s_usage | all.cluster.node.memory.request | Memory Usage |
| k8s_usage | domain.cluster.count | Current number of domain clusters |
| k8s_usage | domain.cluster.node.count | Current number of domain nodes |
| k8s_usage | domain.cluster.node.not_ready_count | The number of unhealthy nodes in the current domain |
| k8s_usage | domain.cluster.node.ready_count | The number of healthy nodes in the current domain |
| k8s_usage | domain.cluster.node.pod.capacity | Maximum number of pods in the current domain |
| k8s_usage | domain.cluster.node.pod.count | The current number of domain pods |
| k8s_usage | domain.cluster.node.cpu.capacity | Current domain cpu total |
| k8s_usage | domain.cluster.node.cpu.limit | Current domain cpu limit |
| k8s_usage | domain.cluster.node.cpu.request | Current domain cpu usage |
| k8s_usage | domain.cluster.node.memory.capacity | Current Domain Memory Total |
| k8s_usage | domain.cluster.node.memory.limit | Current domain memory limit |
| k8s_usage | domain.cluster.node.memory.request | Current domain memory usage |
| k8s_usage | project.cluster.count | Current project cluster number |
| k8s_usage | project.cluster.node.count | Current project node number |
| k8s_usage | project.cluster.node.not_ready_count | Number of unhealthy nodes in the current project |
| k8s_usage | project.cluster.node.ready_count | The number of healthy nodes in the current project |
| k8s_usage | project.cluster.node.pod.capacity | Maximum number of pods in the current project |
| k8s_usage | project.cluster.node.pod.count | The number of pods in the current project |
| k8s_usage | project.cluster.node.cpu.capacity | Current project cpu total |
| k8s_usage | project.cluster.node.cpu.limit | Current project cpu limit |
| k8s_usage | project.cluster.node.cpu.request | Current project cpu usage |
| k8s_usage | project.cluster.node.memory.capacity | Current Project Memory Total |
| k8s_usage | project.cluster.node.memory.limit | Current project memory limit |
| k8s_usage | project.cluster.node.memory.request | Current project memory usage |