Policies
Policies is to set the threshold value for the monitoring index, when the index of the resource exceeds the threshold value, an alert message will be sent to the user through the notification channel immediately, so that the user can respond quickly to solve the problem.
Currently, the following default policies are built into the system.
- process.zombies: Alert when the number of zombie processes on the detected node is greater than 10.
- process.total: Alert when the number of processes on the detected node is greater than 20000.
- system.uptime: detects the alert when the host is offline.
- mem.available: detects when the host is running out of available memory.
- disk.inodes_free/inodes_total: Alert when the disk inode free rate is too low.
- disk.free/total: Alert when detecting low disk idle rate.
- cpu.usage_active: detects an alert when the host CPU utilization is too high.
- host_raid.adapter: Alert when detecting abnormal disk status.
- cloudaccount_balance.balance: Alert when detecting insufficient cloud account balance.
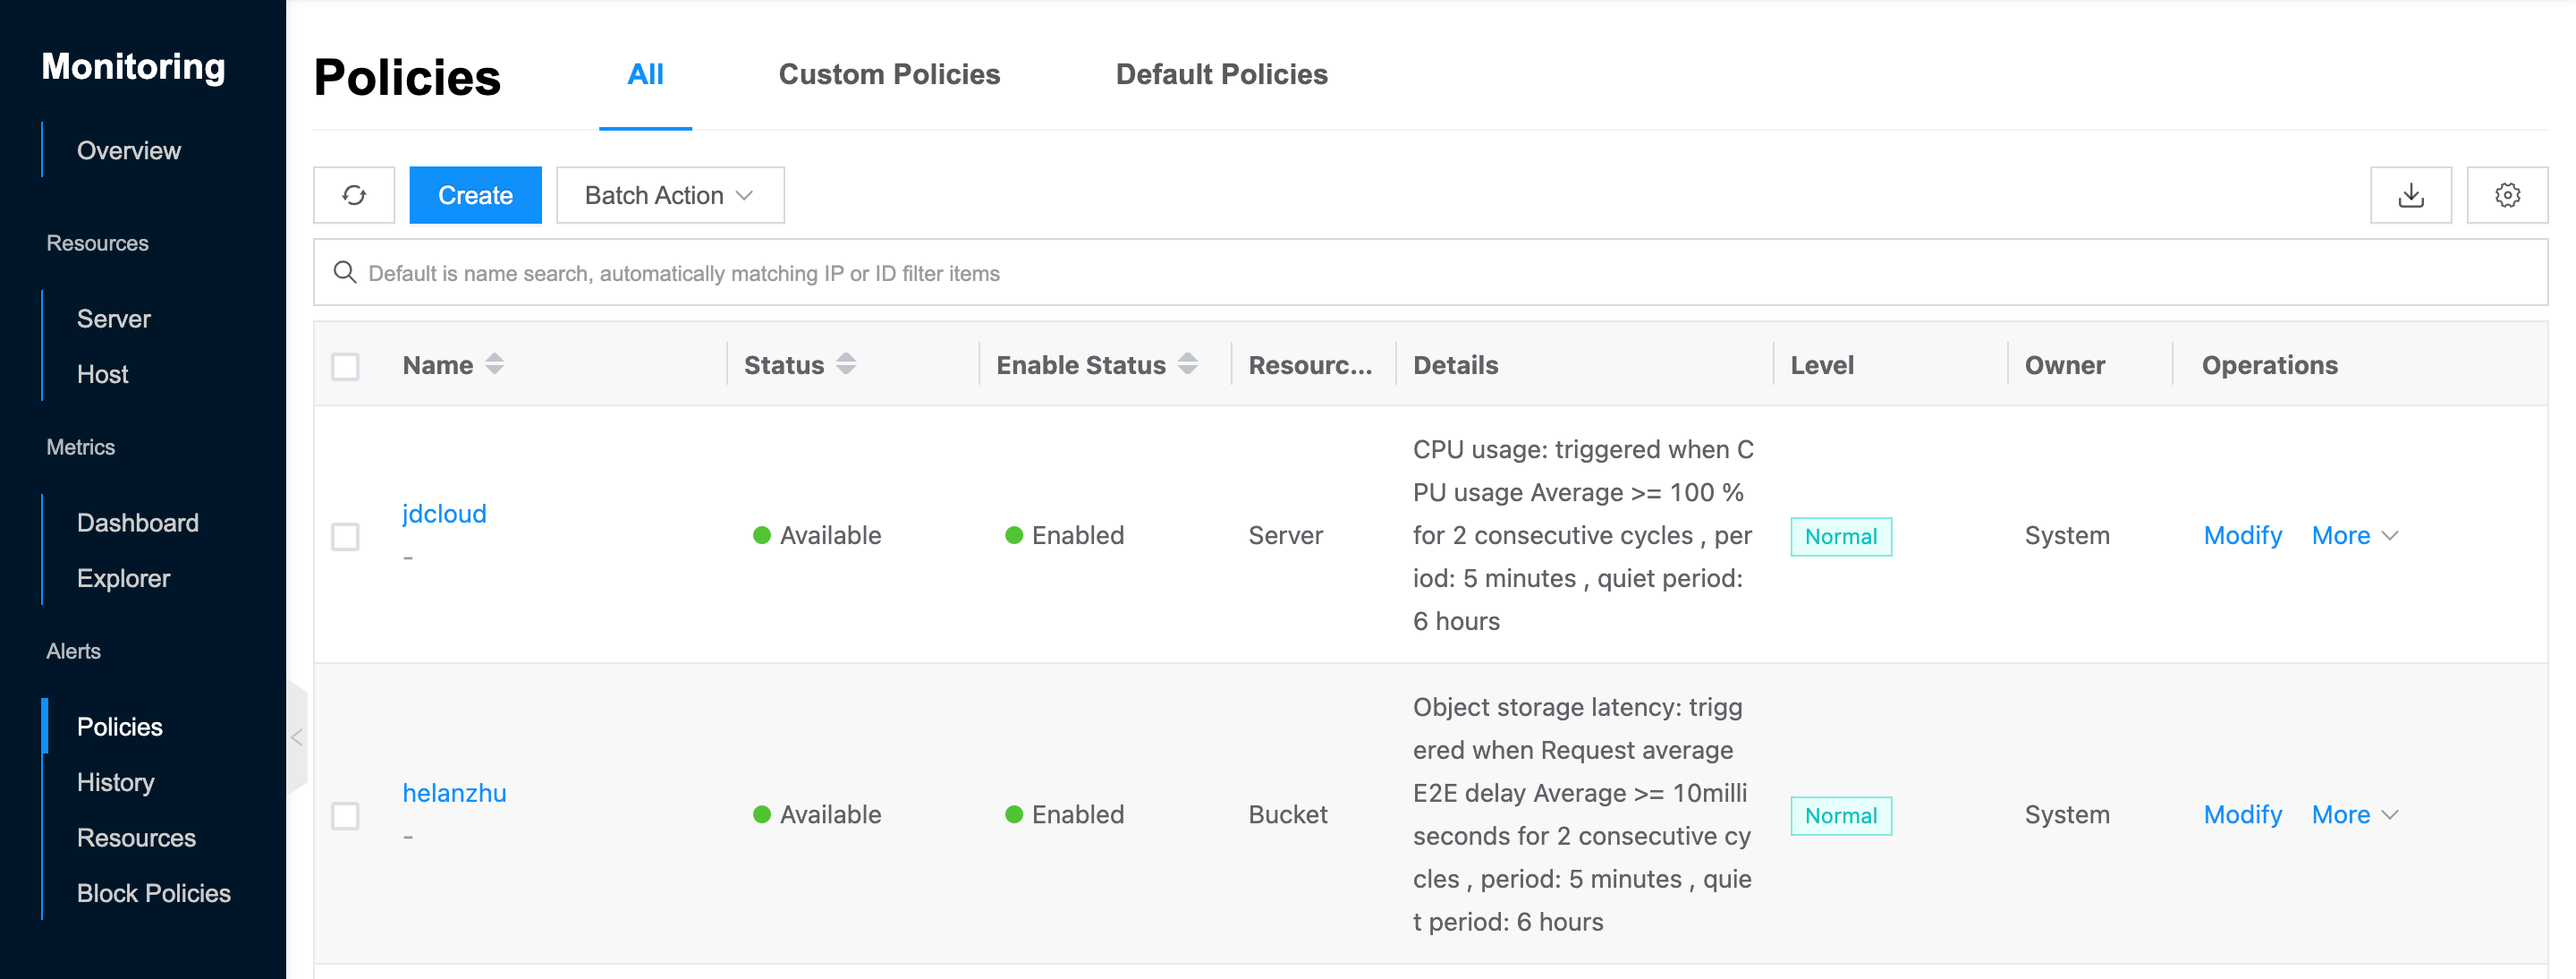
Entry: In the cloud management platform, click the top left corner of  navigation menu, click “Monitoring/Alerts/Policies” menu item in the left menu bar that pops up to enter the Policies page.
Create Alert Policies
This function is used to create alert policies.
- In the Policies page, click the “Create” button at the top of the list to enter the Create Policy page.
- Set the following parameters.
- Owner: Set the scope to which the alerts belongs, including system, domain, and project.
- System: When system is selected, only the system administrator is visible in the administrative background. Only the system backend view is visible.
- Domain: When selecting a domain, you need to select the corresponding domain, and the Domain View defaults to the current domain.
- Project: When selecting a project, you need to select the corresponding project. The project view defaults to the current project.
- Name: Set the name of the alerts.
- Metric: It supports setting specific monitoring indicators through resource types, monitoring indicators, indicator items, etc. It supports monitoring resources such as servers, hosts, cloud accounts, storage buckets, RDS, Redis, etc. that are managed by the platform.
- Filter: The information of the selected indicators of all resources will be displayed by default in the right chart.
- Trigger Condition:Sets the threshold value for the indicator in consecutive time periods, and alert the resources when the average value of the indicators of the resources in the time period exceeds the threshold value.
- Quiet period: Set the interval for sending alert messages. If it has been in the alert state, the second alert message will be sent only after the quiet period after the alert is triggered for the first time. When the alert is restored, the alert restoration notification will be received and the alert will be released. If the data triggers the alert again, the alert message will be sent again.
- Level: Customize the level of setting alerts, including normal, important, and fatal.
- Recipients: Set the recipient who receives the alert message.
Description
- Under system view, all recipients can be selected.
- under domain view, all recipients who are joined to this domain or belong to this domain can be selected.
- Under project view, only the currently logged-in user can be selected.
- Channel: Set the channel for recipients to receive alert messages. When multiple recipients are selected, the channel takes the intersection of the channels supported by the recipient.
- Alert bot: Select the alert bot that receives alert messages.
- Owner: Set the scope to which the alerts belongs, including system, domain, and project.
- Click the “Create” button at the top of the list to create an alerts.
Modify Policies
This function is used to modify the alert policy.
Attention
The default policy does not allow to modify the content of monitoring indicators, etc.
- On the Policies page, click the “Modify” button on the right action bar of the alerts to enter the Modify Policies page.
- Modify the relevant parameters and click the “OK” button to complete the operation.
Enable
This function is used to enable the alerts in the “disabled” state.
Enable
On the Policies page, click the “More” button in the action bar to the right of the disabled alerts, and select the “Enable” menu item to bring up the action confirmation dialog. 2. Click the “OK” button to enable the alerts.
Batch Enable
- Select one or more alert policies in the alerts list, click the**_“Batch Operation”_** button at the top of the list, and select the drop-down menu **_“Enable”_** menu item to bring up the operation confirmation dialog box.
- Click the “OK” button to enable the alerts. Batch Action
Disable
This function is used to disable the alerts in the “enabled” state. The alerts in the disabled state is not effective.
Disable
In the Policies page, click the “More” button in the action bar to the right of the enabled alerts, and select the “Disable” menu item to bring up the action confirmation dialog. Click the “OK” button to disable the alerts.
Batch Disable
- Select one or more alert policies in the alerts list, click the “Batch Operation” button at the top of the list, and select the “Disable” menu item to bring up the action confirmation dialog box.
- Click the “OK” button to disable the alerts. Batch Action
Delete
This function is used to delete the alerts.
Attention
The default policy cannot be deleted.
Delete
- On the Alert Policies page, click the “More” button in the action bar on the right side of the alerts, and select the “Delete” menu item to bring up the action confirmation dialog.
- Click the “OK” button to complete the operation.
Batch Delete
- Select one or more alert policies in the alerts list, click the**_“Batch Operation”_** button at the top of the list, select the drop-down menu **_“Delete”_** menu item, and the operation confirmation dialog box pops up.
- Click the “OK” button to complete the operation. Batch Action
View Policies Details
This function is used to view the details of the alerts.
- On the Policies page, click the Policies Name item to enter the Policies Details page.
- The menu item at the top of the details page supports managing the alerts.
- View the basic information: Cloud ID, ID, name, status, policy attribution, enabled status, policy details, Level, alert robot, alert recipient, created at, updated at, description, etc.
View alert records
This function is used to view the details of the resource that triggered the alert.
- On the Policies page, click the Policies Name item to enter the Policies Details page. Click the Alert History tab to enter the Alert History page.
- View the alert information, and click the number of resources to view the information of the specific resources that have been alerted. Click the “View” button on the right side of the alert log to view the specific information of the alert, etc.
View Operation Logs
- On the Policies page, click the Policies Name item to enter the Policies Details page.
- Click the Operation Log tab to enter the Operation Log page.
- If you want to view more operation logs, please click “Load More” button to get more log information.
- View Log Details: Click the “View” button on the right column of the operation log to view the log details. Copy details are supported.
- View logs of specified time period: If you want to view the operation logs of a certain time period, set the specific date in the start date and end date at the top right of the list to query the log information of the specified time period.
- Export logs: Currently, only the logs displayed on this page are supported to be exported. Click the upper-right corner of
 icon, set the export data column in the pop-up export data dialog, and click the “OK” button to export the logs.