Query
Metrics Query supports user-defined query of CPU, memory, disk, network and other indicators of servers, hosts and other resources in the platform.
Entry: In the cloud management platform, click the top left corner of  navigation menu, and click “Monitoring/Metrics/Query” menu item in the left menu bar that pops up to enter the Query page.
Add query
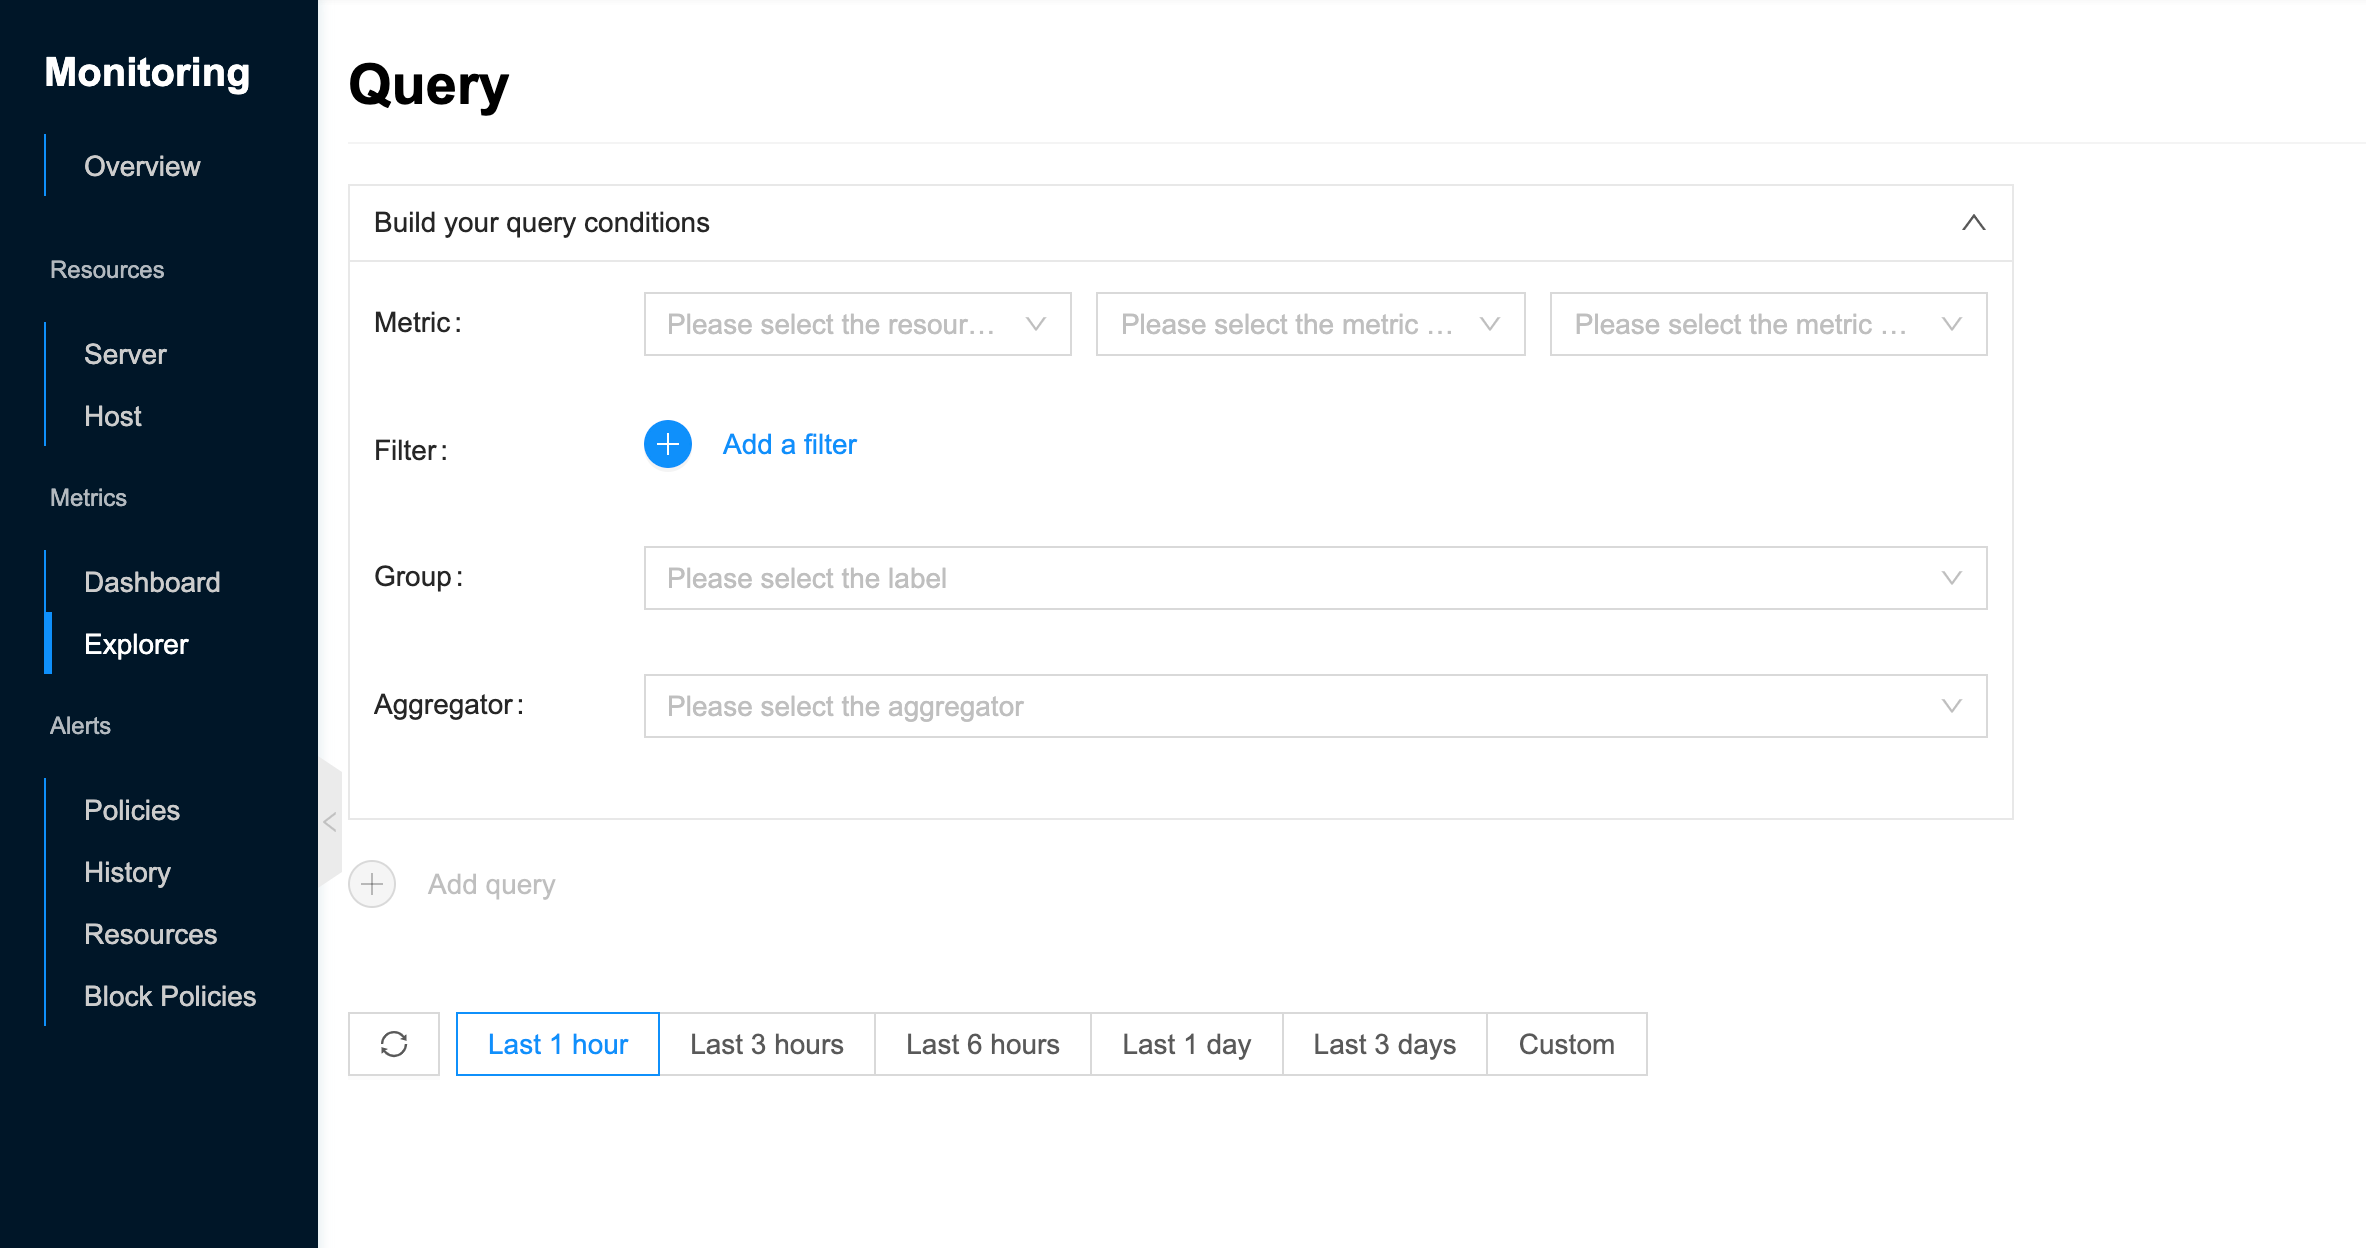
This function is used to customize monitoring data charts. On the left side, you can customize indicators, filter conditions, aggregation grouping, etc. and on the right side, you can display monitoring data charts of corresponding indicators in real time. Support adding multiple queries, each query corresponds to a chart, etc.
- Configure the following parameters in the metrics page to supplement your query conditions.
- Monitoring metrics: It supports setting specific monitoring indicators through resource types, monitoring indicators, indicator items, etc. It supports monitoring resources such as server, server(Agent), host, cloud account, storage bucket, RDS, Redis, etc. that are managed by the platform.
- Filter (optional): The chart on the right will display the information of the selected indicators of all resources by default, and you can filter the data required by the user by platform, region, project and other conditions.
- Grouping (optional): When the query returns a large amount of data, the data can be aggregated into one or more items through grouping and aggregation. Support by platform, region, available area, etc.
- Functions (optional): aggregation functions include mean, maximum, minimum, standard deviation and classification percentile.
- The monitoring chart of the corresponding indicator will be displayed in real time in the chart on the right or lower side. Support to view the monitoring data of last 1 hour, last 3 hours, last 6 hours, last 1 day, last 3 days or custom time.
- After configuring the first query, users can click “Add Query” button to collapse the previous query conditions, add new query conditions, etc.
Collapse Query Conditions
The user can collapse the query criteria and the monitoring chart on the right side will not be collapsed.
- On the Monitor Query page, click on the top right corner of the query condition
 icon to collapse the query criteria.
Delete Query Conditions
When multiple queries exist, the user can delete the query and at least one query setting box will remain.
- On the Monitor Query page, click on the top right corner of the query condition
 icon to delete the query condition.
Save Dashboard
When the chart is queried by the query criteria, it supports saving the chart to the monitoring dashboard, please make sure you have created the monitoring dashboard.
- On the Monitor Query page, click the “Save” button on the top right corner of the chart to bring up the Save dialog box when the chart is queried by the query criteria.
- Configure the icon name and select the monitoring dashboard, and click the “OK” button to save it to the monitoring dashboard.
Monitor metrics support
| Type | Platform | Resourse type | metrics |
| Public Cloud | Alibaba Cloud | VM Instance | CPU |
| Memory | |||
| Disk Usage | |||
| Disk I/O | |||
| Network | |||
| OSS | Object storage latency | ||
| Network traffic | |||
| Request | |||
| RDS | CPU | ||
| Memory | |||
| Disk | |||
| Network | |||
| Cloud Account | Cloud Account Balance | ||
| Tencent Cloud | VM Instance | CPU | |
| Memory | |||
| Disk Usage | |||
| Network | |||
| RDS | CPU | ||
| Memory | |||
| Disk | |||
| Network | |||
| Cloud Account | Cloud Account Balance | ||
| Huawei Cloud | VM Instance | CPU | |
| Memory | |||
| Disk Usage | |||
| Disk I/O | |||
| Network | |||
| OSS | Object storage latency | ||
| Network traffic | |||
| Request | |||
| RDS | CPU | ||
| Memory | |||
| Disk | |||
| Network | |||
| Cloud Account | Cloud Account Balance | ||
| mCloud | VM Instance | CPU | |
| Memory | |||
| Disk Usage | |||
| Disk I/O | |||
| Network | |||
| eCloud | N | ||
| UCloud | N | ||
| JD Cloud | VM Instance | CPU | |
| Memory | |||
| Disk Usage | |||
| Disk I/O | |||
| Network | |||
| RDS | CPU | ||
| Memory | |||
| Disk | |||
| Network | |||
| Cloud Account | Cloud Account Balance | ||
| AWS | VM Instance | CPU | |
| Memory | |||
| Disk Usage | |||
| Disk I/O | |||
| Network | |||
| Azure | VM Instance | CPU | |
| Memory | |||
| Disk Usage | |||
| Disk I/O | |||
| Network | |||
| VM Instance | CPU | ||
| Memory | |||
| Disk Usage | |||
| Disk I/O | |||
| Network | |||
| Private Cloud | OpenStack | VM Instance | CPU |
| Memory | |||
| Disk Usage | |||
| Disk I/O | |||
| Network | |||
| Host | CPU | ||
| Disk Usage | |||
| Disk I/O | |||
| Network | |||
| Storage | Storage Usage | ||
| ZStack | VM Instance | CPU | |
| Memory | |||
| Disk Usage | |||
| Disk I/O | |||
| Network | |||
| Host | CPU | ||
| Disk Usage | |||
| Disk I/O | |||
| Network | |||
| Storage | Storage Usage | ||
| On-premise | OneCloud | VM Instance | CPU |
| Memory | |||
| Disk Usage | |||
| Disk I/O | |||
| Network | |||
| Host | CPU | ||
| Disk Usage | |||
| Disk I/O | |||
| Network | |||
| Storage | Storage Usage | ||
| VMware | VM Instance | CPU | |
| Memory | |||
| Disk Usage | |||
| Disk I/O | |||
| Network | |||
| Host | CPU | ||
| Disk Usage | |||
| Disk I/O | |||
| Network | |||
| Storage | Storage Usage |