Overview
The monitoring overview supports viewing monitoring alerts in the system from various dimensions.
Monitoring Overview supports viewing the total number of unrecovered alerts, the trend of alerts in the last 30 days, and the monitoring situation in the system from different dimensions.
Entry: In the cloud management platform, click on the top left corner of  navigation menu, and click “Monitoring/Overview” menu item in the pop-up left menu bar to enter the overview page.
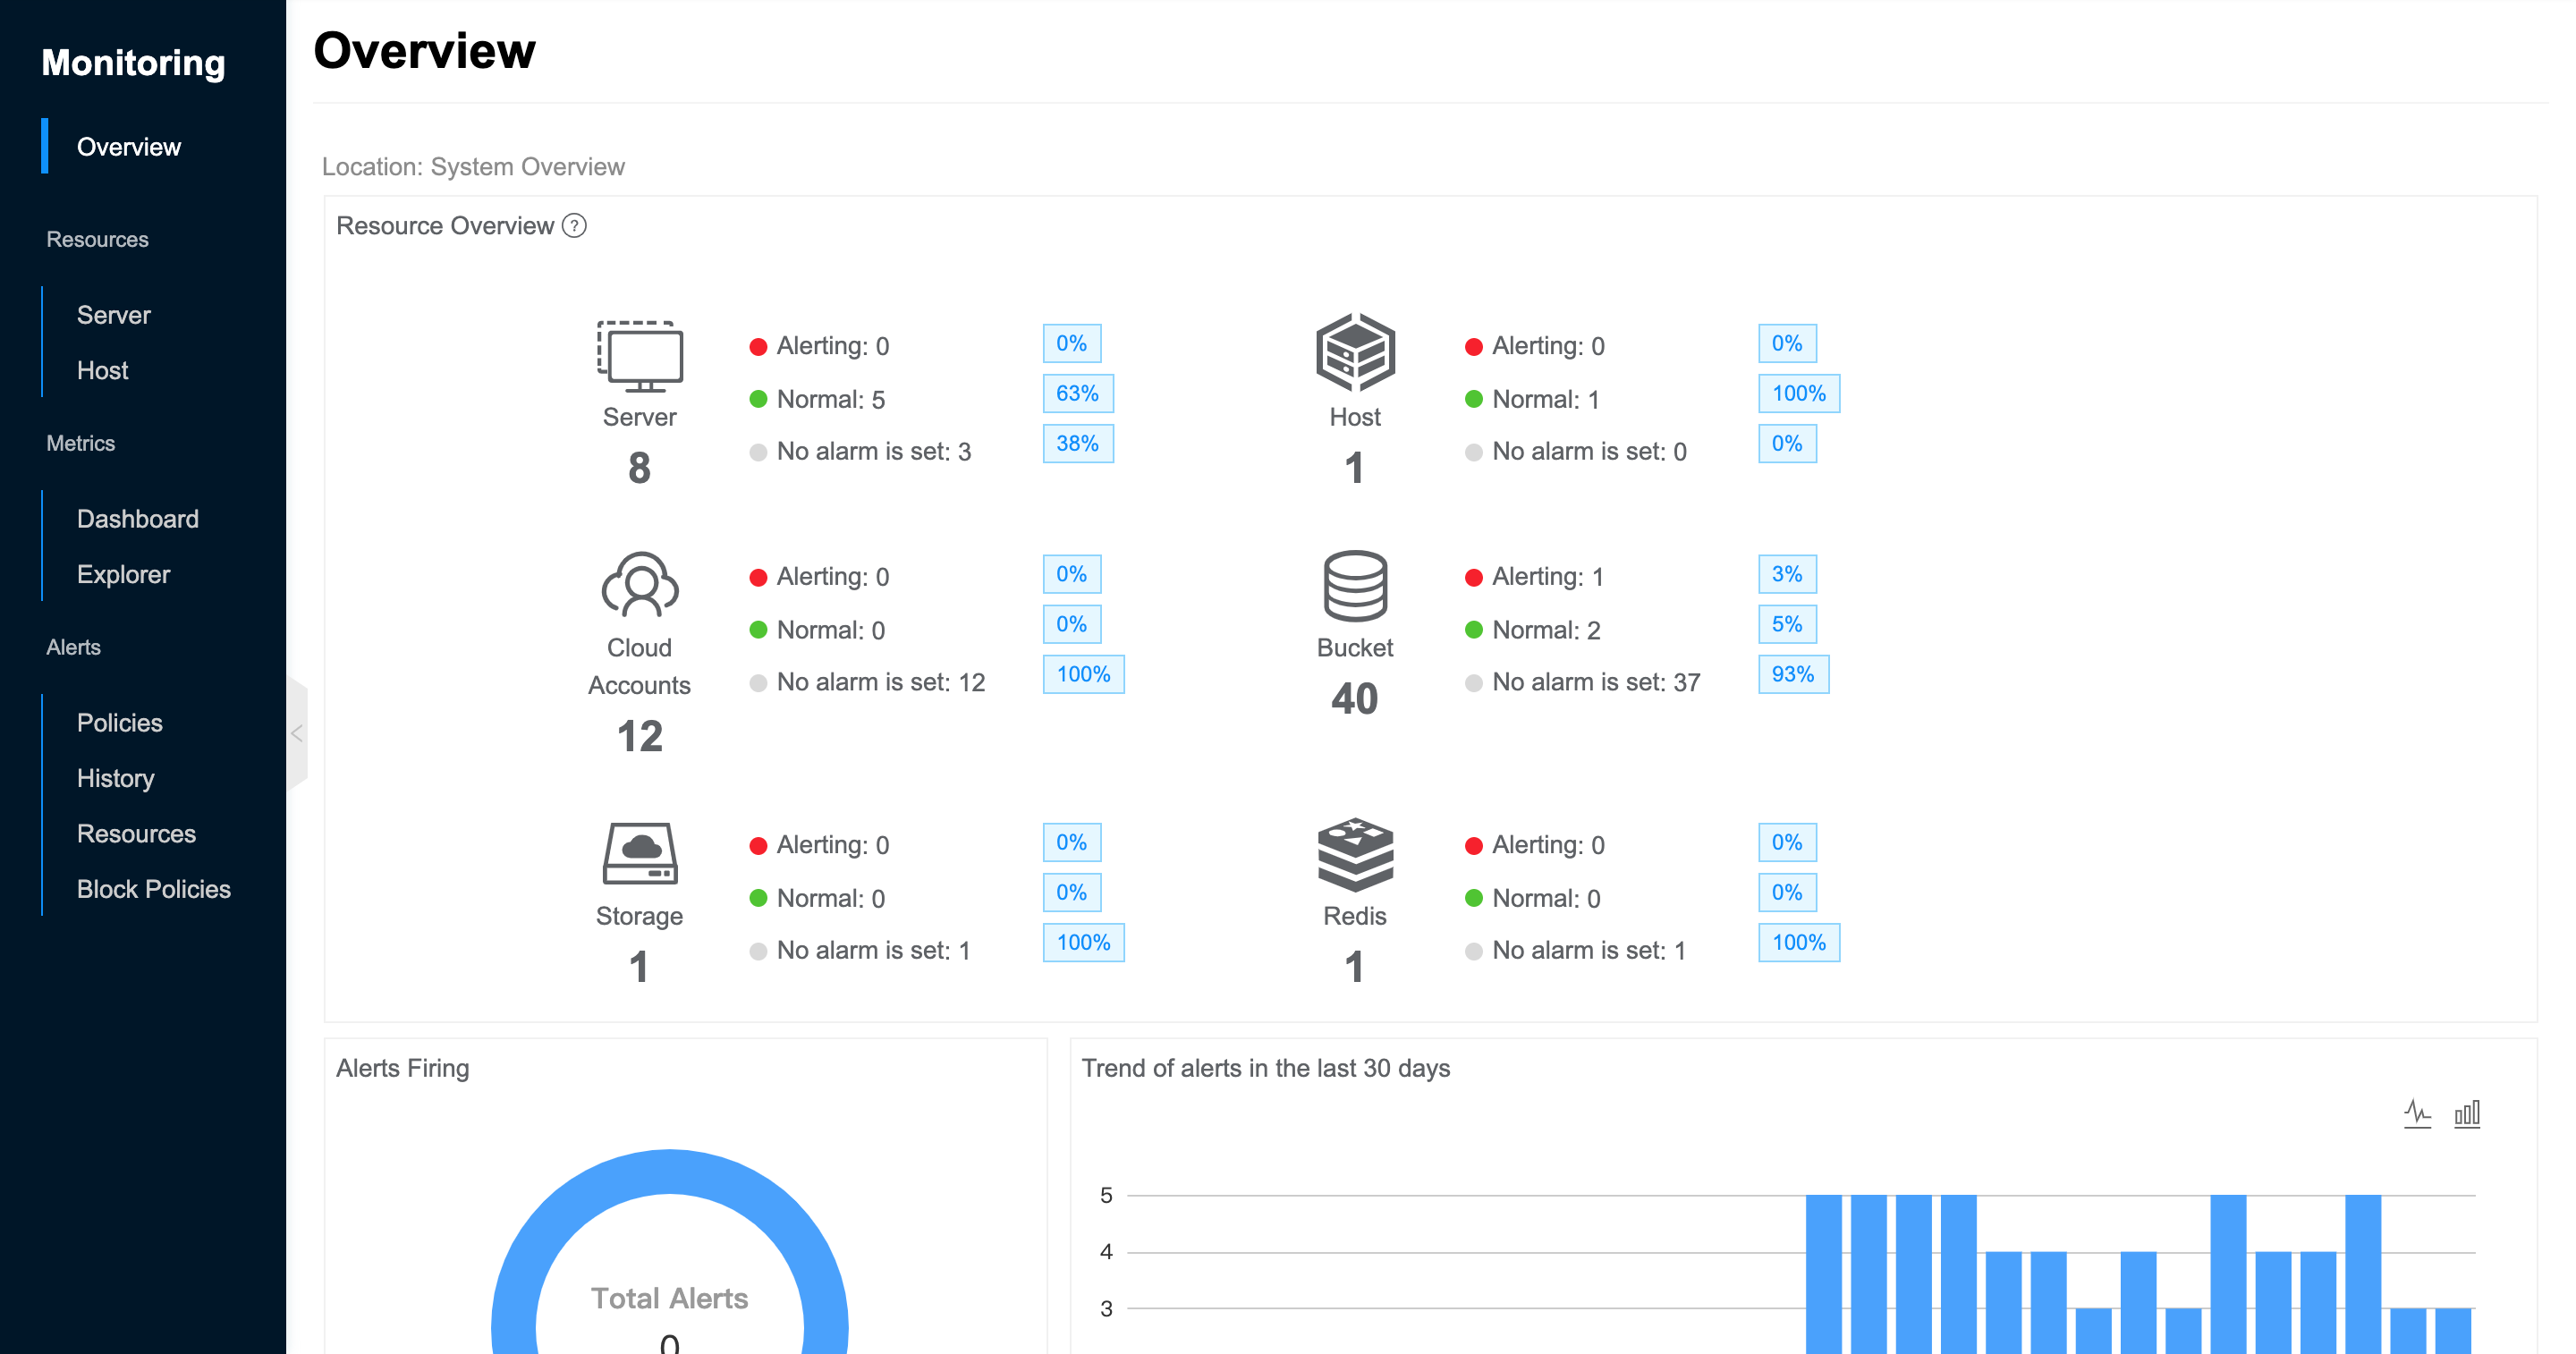
View System Overview
The following indicators are supported to be viewed under the system view.
- Resource Overview.
- Servers: Shows the total number of servers in the system, as well as the number and percentage of servers with alerting, normal status, and no alarm is set.
- Hosts: Shows the total number of hosts in the system, as well as the number and percentage of hosts with alerting, normal status, and no alarm is set.
- Cloud accounts: Shows the total number of cloud accounts in the system, as well as the number and percentage of cloud accounts with alerting, normal status, and no alarm is set.
- Bucket: Shows the total number of bucket in the system, as well as the number and percentage of bucket with alerting, normal status, and no alarm is set.
- RDS: Shows the total number of RDSs in the system, as well as the number and percentage of RDSs with alerting, normal status, and no alarm is set.
- Redis: Shows the total number of Redis in the system, as well as the number and percentage of Redis with alerting, normal status, and no alarm is set.
- Storage: Shows the total number of block stores in the system, as well as the number and percentage of block stores with alerting, normal status, and no alarm is set.
- Alert Firing: Displays the number of all unrecovered alerts in the system, and supports displaying the total number of unrecovered alerts and the number of alerts for different resource types in a ring chart. Clicking on it will jump to the Alarm History - Unrecovered Alarms page.
- Trend of alerts in the last 30 days: Supports displaying the number of alerts in the system in the last 30 days, the number of alerts of different resource types, the proportion of the total number of alerts, and the alarm trend in the form of line graph or stacked bar graph. By clicking on the top right corner of
 icon to switch the display format of the trend graph.
 - Support viewing system metrics.
- View the average CPU usage, memory usage, disk usage, disk read rate, disk write rate, network inbound traffic, network outbound traffic, and other metrics of the server in the last N days. Among them, the memory usage and disk usage metrics need to install the monitoring agent for the virtual machine.
- Check the average average CPU usage, disk read rate, disk write rate, network inbound traffic, network outbound traffic, and other metrics of Top N in the last N days of the host.
- The default is server or host, which means no aggregation. You can view the metrics of server or host under the specified dimension by system, domain, project, platform, region, availability zone, etc.
- System: Used to view the average usage of servers or hosts on the platform.
- Domain: Used to view the average usage of servers or hosts under different domains.
- Project: Used to view the average usage of servers under different projects.
- Platforms: Used to view the average usage of servers or hosts under different platforms.
- Zones: To view the average usage of servers or hosts under different zones.
- Availability Zones: Used to view the average usage of servers or hosts under different availability zones.
- Time range includes Last 1 hour, Last 6 hours, Last 12 hours, Last 1 day, Last 7 days, Last 14 days, Last 1 month, Default is Last 7 days.
- Top N includes Top10, Top20, All, and the default is Top10.
- The list is used to display the average CPU utilization, network incoming traffic, network outgoing traffic, disk read rate, disk write rate and other indicators of servers or hosts under different aggregation dimensions in the last N days. Supports clicking the top right corner of the table
 icon to export the corresponding monitoring data.
View Domain Overview
The following metrics are supported to be viewed under the domain view.
- Resource Overview.
- Servers: Shows the total number of servers in the domain, as well as the number and percentage of servers with alerting, normal status, and no alarm is set.
- Hosts: Shows the total number of hosts in the domain, as well as the number and percentage of hosts with alerting, normal status, and no alarm is set.
- Cloud accounts: Shows the total number of cloud accounts in the domain, as well as the number and percentage of cloud accounts with alerting, normal status, and no alarm is set.
- Bucket: Shows the total number of bucket in the domain, as well as the number and percentage of bucket with alerting, normal status, and no alarm is set.
- RDS: Shows the total number of RDSs in the domain, as well as the number and percentage of RDSs with alerting, normal status, and no alarm is set.
- Redis: Shows the total number of Redis in the domain, as well as the number and percentage of Redis with alerting, normal status, and no alarm is set.
- Storage: Shows the total number of block stores in the domain, as well as the number and percentage of block stores with alerting, normal status, and no alarm is set.
- Alert Firing: Shows the number of all unrecovered alerts in the domain, and supports displaying the total number of unrecovered alerts and the number of alerts for different resource types in the form of a ring chart. Clicking on it will jump to the Alarm History - Unrecovered Alarms page.
- Trend of alerts in the last 30 days: Supports displaying the number of alerts in the domain for the last 30 days, the proportion of different resource types in the total number of alerts, and the alarm trend as a line or bar chart. By clicking on the top right corner of icon to switch the display format of the trend graph.
- Support viewing system metrics.
- View the average CPU usage, memory usage, disk usage, disk read rate, disk write rate, network inbound traffic, network outbound traffic, and other metrics of the server in the last N days. Among them, the memory usage and disk usage metrics need to install the monitoring agent for the virtual machine.
- Check the average average CPU usage, disk read rate, disk write rate, network inbound traffic, network outbound traffic, and other metrics of Top N in the last N days of the host.
- The default is server or host, which means no aggregation. You can view the metrics of server or host under the specified dimension by domain, project, platform, region, availability zone, etc.
- Domain: Used to view the average usage of servers or hosts under different domains.
- Project: Used to view the average usage of servers under different projects.
- Platforms: Used to view the average usage of servers or hosts under different platforms.
- Zones: To view the average usage of servers or hosts under different zones.
- Availability Zones: Used to view the average usage of servers or hosts under different availability zones.
- Time range includes Last 1 hour, Last 6 hours, Last 12 hours, Last 1 day, Last 7 days, Last 14 days, Last 1 month, Default is Last 7 days.
- Top N includes Top10, Top20, All, and the default is Top10.
- The list is used to display the average CPU utilization, network incoming traffic, network outgoing traffic, disk read rate, disk write rate and other indicators of servers or hosts under different aggregation dimensions in the last N days. Supports clicking the top right corner of the table icon to export the corresponding monitoring data.
View Project Overview
The following metrics are supported to be viewed under the project view.
- Resource Overview.
- Servers: Shows the total number of servers in the domain, as well as the number and percentage of servers with alerting, normal status, and no alarm is set.
- Bucket: Shows the total number of bucket in the domain, as well as the number and percentage of bucket with alerting, normal status, and no alarm is set.
- RDS: Shows the total number of RDSs in the domain, as well as the number and percentage of RDSs with alerting, normal status, and no alarm is set.
- Redis: Shows the total number of Redis in the domain, as well as the number and percentage of Redis with alerting, normal status, and no alarm is set.
- Alert Firing: Shows the number of all unrecovered alerts in the project, and supports displaying the total number of unrecovered alerts and the number of alerts of different resource types in the form of a ring chart. Clicking on it will jump to the Alarm History - Unrecovered Alarms page.
- Trend of alerts in the last 30 days: The number of alerts in the last 30 days, the proportion of different resource types in the total number of alerts and the trend of alerts are displayed as line or bar charts. By clicking on the top right corner of icon to switch the display format of the trend graph.
- Support viewing system metrics.
- View the average CPU usage, memory usage, disk usage, disk read rate, disk write rate, network inbound traffic, network outbound traffic, and other metrics of the server in the last N days. Among them, the memory usage and disk usage metrics need to install the monitoring agent for the virtual machine.
- Check the average average CPU usage, disk read rate, disk write rate, network inbound traffic, network outbound traffic, and other metrics of Top N in the last N days of the host.
- The default is server or host, which means no aggregation. You can view the metrics of server or host under the specified dimension by domain, project, platform, region, availability zone, etc.
- Project: Used to view the average usage of servers under different projects.
- Platforms: Used to view the average usage of servers under different platforms.
- Zones: To view the average usage of servers under different zones.
- Availability Zones: Used to view the average usage of servers under different availability zones.
- Time range includes Last 1 hour, Last 6 hours, Last 12 hours, Last 1 day, Last 7 days, Last 14 days, Last 1 month, Default is Last 7 days.
- Top N includes Top10, Top20, All, and the default is Top10.
- The list is used to display the average CPU utilization, network incoming traffic, network outgoing traffic, disk read rate, disk write rate and other indicators of servers or hosts under different aggregation dimensions in the last N days. Supports clicking the top right corner of the table icon to export the corresponding monitoring data.