Nodes
This page shows only the node information of the Kubernetes cluster created in the cloud management platform.
A Kubernetes cluster consists of 1 to 3 control nodes and n compute nodes. The nodes are the actual operating environment of the Pod.
- The controlplane, or Master node, is a combination of three independent components that work closely together: kube-apiserver for API services, kube-scheduler for scheduling, and kube-controller-manager for container orchestration. The persistent data of the whole cluster is processed by the kube-apiserver and stored in Etcd.
- Compute node (Node): The node used to run the business. Generally user-created pods are only allowed in the node node.
Entry: In the cloud management platform click on the top left corner navigation menu, and click “Containers/Clusters/Nodes” menu item in the left menu bar that pops up to enter the node page.
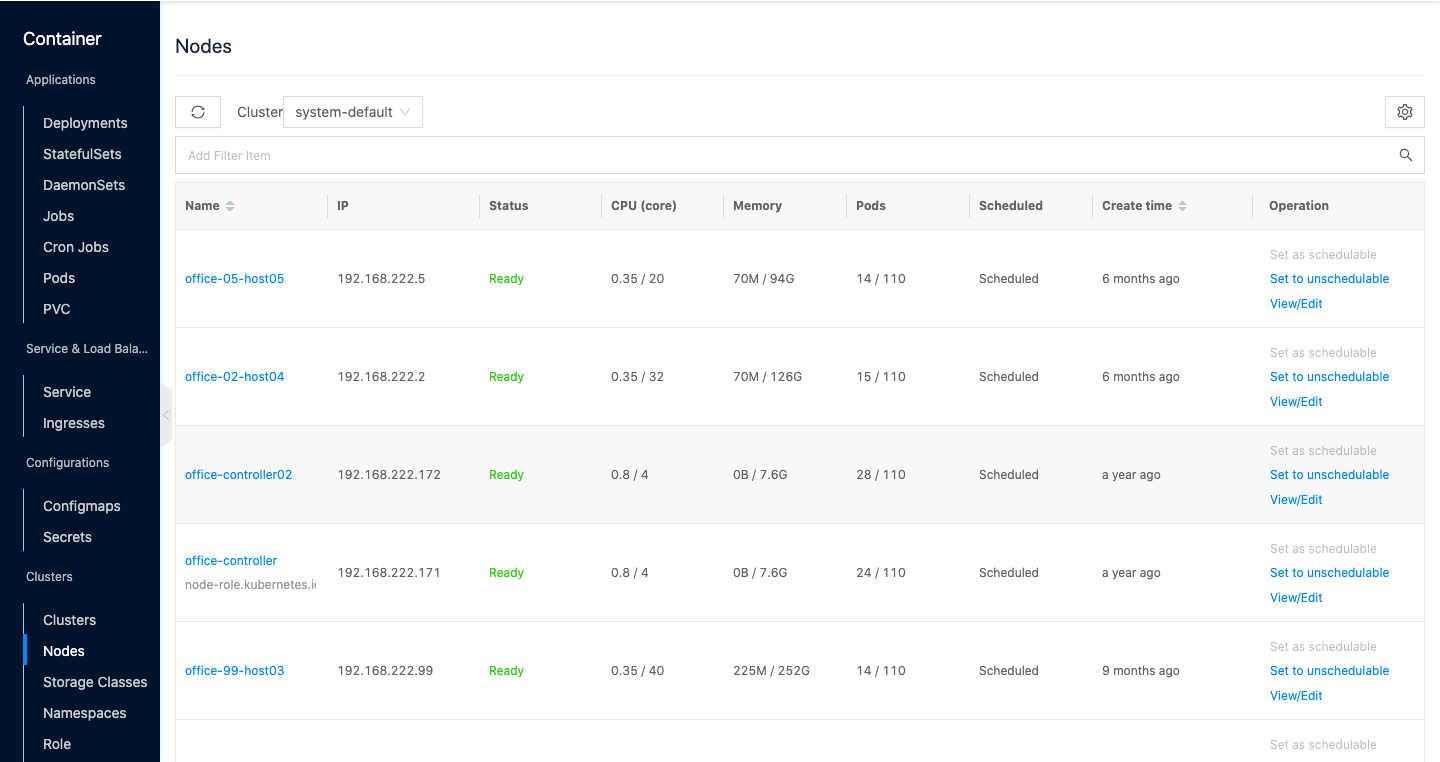
View nodes
This function is used to view the node information of a cluster.
-
In the nodes page, by default, you can view the node information under one cluster.
-
When there are multiple clusters in the environment, you can click the input box on the right side of the cluster above the list and select other clusters to view the node information under other clusters.

Set as schedulable
This function is used to set whether the node can be used to create Pods when the node is schedulable.
- On the node page, click the “Set as schedulable” button on the right column of the node that is not schedulable to set the node to schedulable status.
Set as non-schedulable
This function is used to set whether the node can create Pods or not. When the node is not schedulable, the node cannot be used to create Pods.
- On the node page, click the “Set as non-schedulable” button on the right column of the schedulable node to set the node to the non-schedulable state.
View/Edit
This function is used to view and edit the node’s yaml file.
- On the node page, click the “View/Edit” button on the right action bar of the node to bring up the View/Edit dialog box.
- Support viewing and editing the yaml file information of the route.
- After editing the yaml file, click the “OK” button to take effect.
View Node Details
This function is used to view the details of a node.
- On the node page, click the input box on the right side of the cluster above the list, and select the specified cluster. Click the node name item to enter the node details page.
- View the following information.
- Dashboard: View the total number of CPU cores, allocated and utilization, total amount of memory, allocated and utilization, and total amount of container groups, allocated and utilization of the node.
- Basic Information: Including Cloud ID, ID, name, status, domain, project, cluster, schedulable, created at, updated at, and description.
- Operating system: View node name, zone, operating system and other related information.
- Note: view node node ID, socket, ttl, IP address, tunnel IP address, etc. of the node
- Tags: view node’s tag information.
- Taints: View the taint of the node. Only pods that have taints matching the node are assigned to the node.
View Container Group
This function is used to view the container groups created by the node and supports managing container groups.
View/Edit
This function is used to view the yaml file of a container group.
- On the node page, click the node name item to enter the node details page.
- Click the “Container Group” tab to enter the container group page.
- Click the “View/Edit” button on the right column of the container group to bring up the View/Update dialog box.
- Support viewing and editing the yaml file information of the node.
- After editing the yaml file, click the “OK” button to take effect.
Delete
This function is used to delete a container group. After the container group is deleted, a new container group will be redeployed according to the yaml file settings.
- On the node page, click the node name item to enter the node details page.
- Click the “Container Group” tab to enter the container group page.
- Click the “Delete” button on the right action bar of the container group to bring up the action confirmation dialog.
- Click the “OK” button to complete the operation.
View Status
This function is used to view the status information of the node.
- On the node page, click the node name item to enter the node details page.
- Click the Status tab to enter the Status page.
- View the following information about the node.
- type: The name of the pod status.
- status: Indicates whether the status is applicable, the possible values are “True”, “False” or “Unknown”.
- lastTransitionTime: timestamp of when the Pod last transitioned from one state to another.
- reason: machine-readable, UpperCamelCase text that expresses the reason for the last status change.
- message: human-readable message giving details of the last state transition.
View events
This function is used to record a record of the occurrence of a resource object event, including the content, source, cause, and created at, for troubleshooting purposes.
- On the Node page, click the Node Name item to enter the Node Details page.
- Click the Events tab to enter the Events page. View the content, source, cause, and created at of the event.
View Source Information
This function is used to view and edit the yaml information of the node.
- On the node page, click the node name item to enter the node details page.
- Click the “Source Information” tab to enter the source information page.
- Click the “Copy Content” button to copy the yaml file information of the node.
- After updating the yaml file, click the “Update” button.
View Operation Log
This function is used to view the operation logs related to the node.
- On the node page, click the node name item to enter the node details page.
- Click the Operation Log tab to enter the Operation Log page.
- Load more logs: In the Operation Log page, the list shows 20 operation logs by default. To view more operation logs, please click “Load more” button to get more log information.
- View Log Details: Click the “View” button on the right column of the operation log to view the log details. Copy details are supported.
- View logs of specified time period: If you want to view the operation logs of a certain time period, set the specific date in the start date and end date at the top right of the list to query the log information of the specified time period.
- Export logs: Currently, only the logs displayed on this page are supported to be exported. Click the upper-right corner of
 icon, set the export data column in the pop-up export data dialog, and click the “OK” button to export the logs.