Dashboard
The dashboard is used to display monitoring chart information that saves the query conditions of monitoring queries.
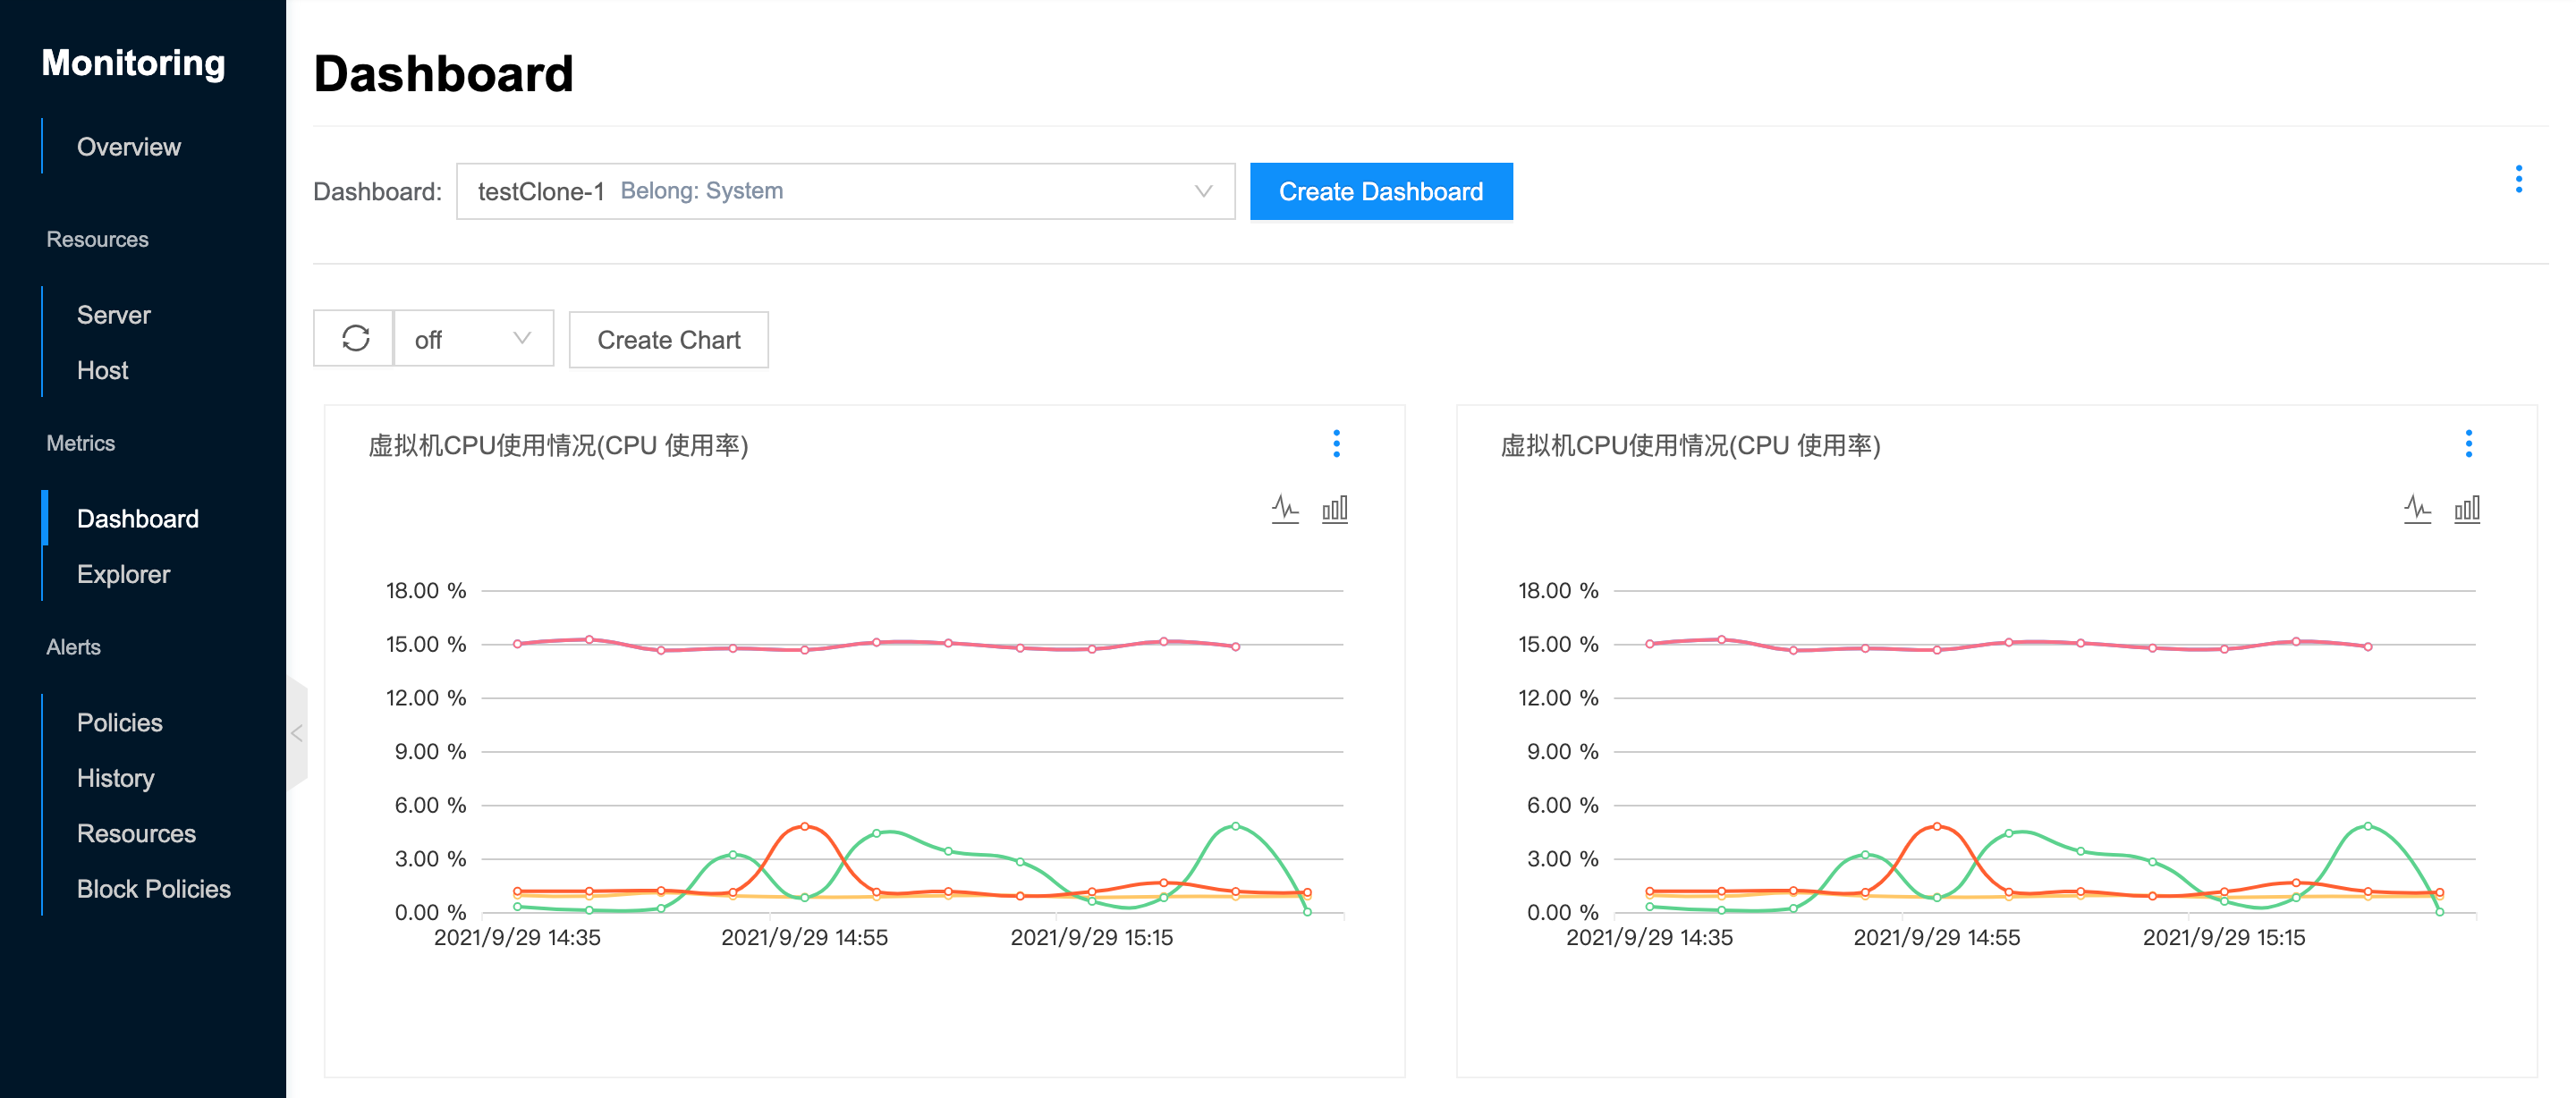
Entry: In the cloud management platform, click the top left corner of  navigation menu, and click “Monitoring/Metrics/Dashboard” menu item in the left menu bar that pops up to enter the Monitoring Dashboard page.
Dashboard Management
This function is used to manage the dashboard.
Create Dashboard
This function is used to create a dashboard.
In the Monitor Dashboard page, click the “Create Dashboard” button to bring up the Create Dashboard dialog box. 2. Set the following parameters. - Scope: Set the scope to which the dashboard belongs, including system, domain, and project. - System: When system is selected, only the system administrator is visible in the admin backend. Only the administrative backend view is visible. - Domain: When you select Domain, you need to select the corresponding domain, and the domain management background defaults to the current domain. - Project: When selecting a project, you need to select the corresponding project. The project view defaults to the current project. - Name: Set the name of the dashboard. 3. Click “OK” button to create a new dashboard.
Clone Dashboard
This function is used to clone a monitoring panel with identical monitoring charts based on an existing monitoring panel.
- In the Monitor Dashboard page, click on the top right corner of the panel
 icon and select the drop-down menu “Clone” menu item to bring up the Clone Dashboard dialog box. 2.
 - Enter the name of the new panel and click “OK” button.
Delete Dashboard
This function is used to delete a dashboard.
- On the Monitor Dashboard page, click the top right corner of the dashboard icon, select the drop-down menu “Delete” menu item, and the action confirmation dialog box will pop up.
- Click “OK” button to complete the operation.
Switch Dashboard
This function is used to switch the display of the monitor dashboard.
- On the Monitor Dashboard page, click the drop-down selection box on the right side of the upper dashboard to switch the display dashboard.
Chart Management
This function is used to manage the charts on the dashboard.
Create Chart
This function is used to add a chart to the displayed monitor dashboard.
- On the Monitor Dashboard page, click the “Create Chart” button to enter the Add Chart page.
- Configure the following parameters.
- Name: The name of the custom chart.
- Monitoring metrics: It supports setting specific monitoring indicators through resource types, monitoring indicators, indicator items, etc. It supports monitoring resources such as servers, hosts, cloud accounts, storage buckets, RDS, Redis, etc. that are managed by the platform.
- Filter (optional): The chart on the right will display the information of the selected indicators of all resources by default, and you can filter the data required by the user by platform, region, project and other conditions.
- Grouping (optional): When the query returns a large amount of data, the data can be aggregated into one or more items through grouping and aggregation. Support by platform, region, available area, etc.
- Functions (optional): aggregation functions include mean, maximum, minimum, standard deviation and classification percentile.
- The monitoring chart of the corresponding indicator will be displayed in real time in the chart on the right or lower side. Support to view the monitoring data of last 1 hour, last 3 hours, last 6 hours, last 1 day, last 3 days or custom time.
- Click “OK” button to save the chart to the dashboard.
Edit Chart
This function is used to modify the query criteria and display time of the chart.
- On the Dashboard page, click the top right corner of the chart icon and select the drop-down menu “Edit” menu item to enter the Update Chart page.
- Configure the following parameters.
- Name: the name of the custom chart.
- Monitoring metrics: It supports setting specific monitoring indicators through resource types, monitoring indicators, indicator items, etc. It supports monitoring resources such as servers, hosts, cloud accounts, storage buckets, RDS, Redis, etc. that are managed by the platform.
- Filter (optional): The chart on the right will display the information of the selected indicators of all resources by default, and you can filter the data required by the user by platform, region, project and other conditions.
- Grouping (optional): When the query returns a large amount of data, the data can be aggregated into one or more items through grouping and aggregation. Support by platform, region, available area, etc.
- Functions (optional): aggregation functions include mean, maximum, minimum, standard deviation and classification percentile.
- The monitoring chart of the corresponding indicator will be displayed in real time in the chart on the right or lower side. Support to view the monitoring data of last 1 hour, last 3 hours, last 6 hours, last 1 day, last 3 days or custom time.
- Click “OK” button to modify the chart.
Cloning Charts
This function is used to clone a monitoring chart with identical indicators based on an existing monitoring chart.
- In the monitoring panel page, click on the top right corner of the chart icon and select the drop-down menu “Clone” menu item to enter the Update Chart page.
- Enter the name of the icon and click “OK” button.
Delete Chart
This function is used to delete a chart.
- On the Dashboard page, click the upper right corner of the chart icon, select the drop-down menu “Delete” menu item to bring up the action confirmation dialog.
- Click “OK” button to complete the operation.
View Chart
This function is used to view the information about the chart.
- By default, the chart is displayed in the form of a line chart.
- The display time of the chart is related to the time set when adding the chart.
- The drop-down list to the right of the “Add Chart” button is the automatic refresh time, which is off by default and supports setting the refresh time.